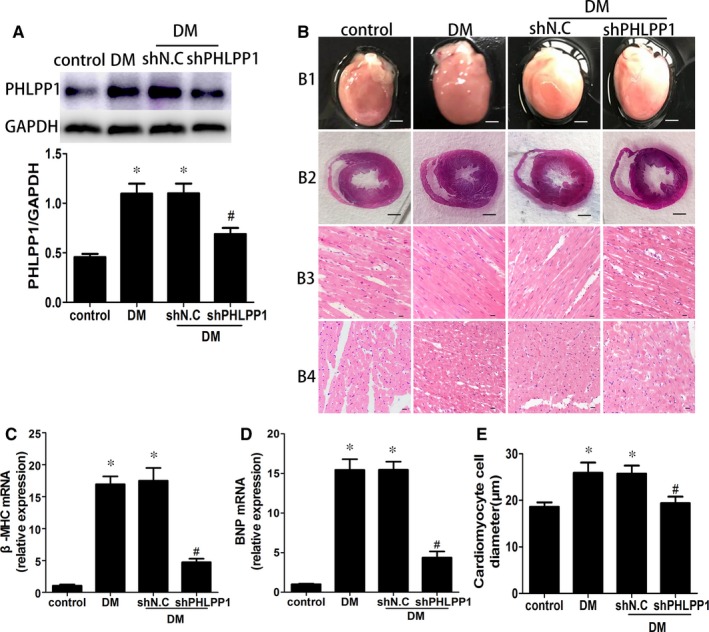
Figure 1.

PHLPP1 expression and pathology of control and diabetic rat hearts. A, Western blot analysis of PHLPP1 protein levels (n = 6 per group). B1, Heart size (scale bar: 3 mm, n = 8 per group). B2, HE staining of cross shaft of musculi papillares in heart (n = 8 per group). B3, Representative haematoxylin and eosin staining (HE) of longitudinal left ventricular (LV) sections (scale bar: 20 μm, n = 8 per group). B4, Representative HE staining of LV transverse sections (scale bar: 20 μm, n = 8 per group). C, Relative mRNA fold changes of β‐MHC (n = 6 per group). D, Relative mRNA fold changes of BNP (n = 6 per group). E, Quantitative analysis of cardiomyocyte cell diameter (n = 8 per group). Control: normal rats. DM: diabetes mellitus. shN.C: negative control shRNA. shPHLPP1: PHLPP1 shRNA. All experiments were performed at least 3 times. Data are expressed as the means ± SD. Statistical analysis was performed using one‐way ANOVA followed by Bonferroni's post hoc test. *P < .05 compared with controls; #P < .05 compared with DM or shN.C in DM
