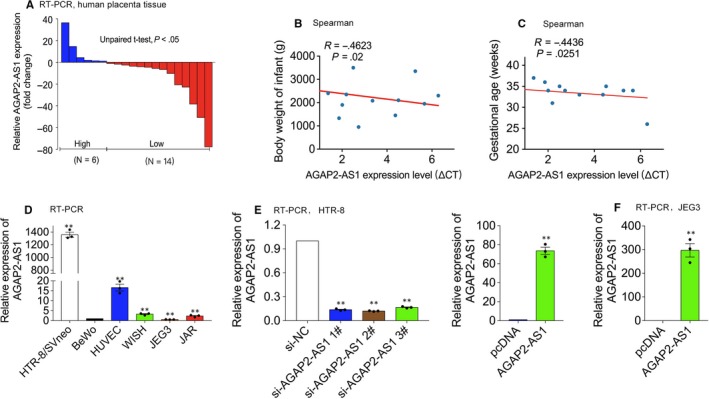
Figure 1.

Relative AGAP2‐AS1 Expression in PE. A, qPCR results of AGAP2‐AS1 expression in pre‐eclamptic and the control (n = 20). Data are represented as log2 fold changes (PE/normal, shown as −ΔΔCT) and defined as ‘<0’ for underexpression and ‘>0’ for overexpression. The defined 0 fold of the expression represents −ΔΔCT is 0. B and C, Spearman correlations between AGAP2‐AS1 and body weight of the infant or gestational age. D, qPCR results of AGAP2‐AS1 in trophoblasts cell lines and normalized to that in BeWo. E, HTR/SVneo cells transfected with AGAP2‐AS1–specific siRNAs (siAGAP2‐AS1). F, HTR‐8/SVneo and JEG3 treated with AGAP2‐AS1 plasmid. Data are presented as the mean ± SEM, *P < .05, **P < .01
