
Figure 6.
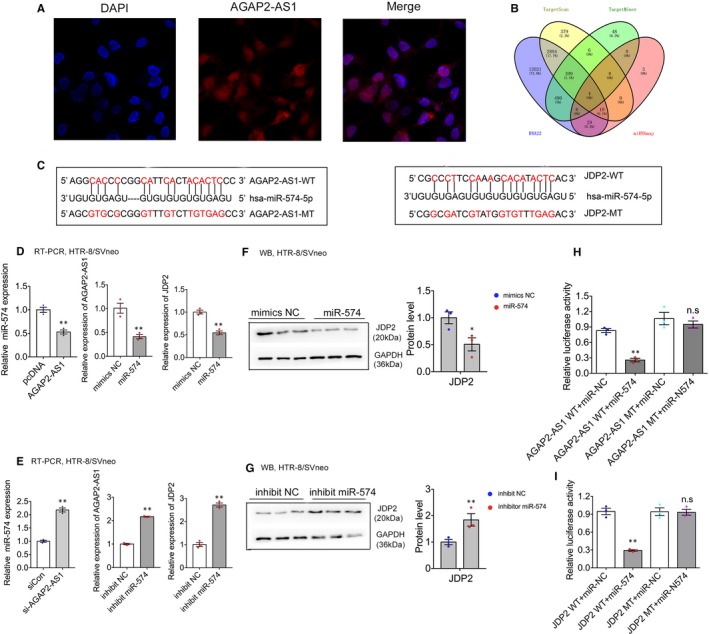
AGAP2‐AS1 regulates JDP2 expression by AGAP2‐AS1/miR‐574 axis. A, AGAP2‐AS1 location was detected by FISH in HTR‐8/SVneo. Red, AGAP2‐AS1; blue, DAPI. B, Bioinformatics analysis exhibited the binding probability between JDP2 and miR‐574. C, The RNAup algorithm predicted latent binding of miR‐574 to AGAP2‐AS1 and JDP2, with conservative sequence in the 3′‐UTR regions. D and E, HTR‐8/SVneo cells were treated with siCon or si‐AGAP2‐AS1, mimics NC or mimics miR‐574, inhibit NC or inhibitor miR‐574. Using RT‐PCR and Western blotting analysis to detect miR‐574 (on the left), AGAP2‐AS1 (in the middle) and JDP2 expression (on the right), respectively. F and G, Western blotting analysis was performed to test JDP2 expression at protein level after treated with mimics NC or mimics miR‐574, inhibit NC or inhibitor miR‐574. H, Luciferase reporter assays were conducted to detect the interacting activity between miR‐574 with AGAP2‐AS1/JDP2, normalized by Renilla activity. Numbers are shown as the mean ± SEM, **P < .01, *P < .05