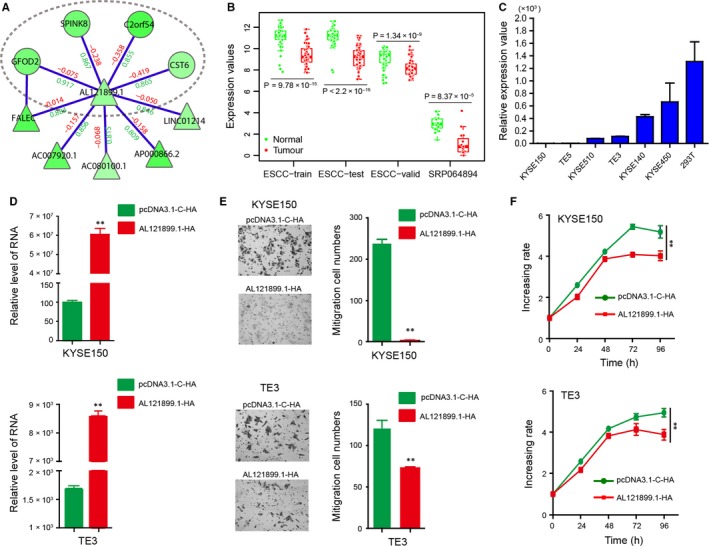
Figure 4.

AL121899.1‐associated core module. A, Visualization of the AL121899.1‐associated core module. Region in the elliptic curve is the frequently identified core module. B, Comparison of AL121899.1 expression between normal and tumour samples in multiple data sets. C, qRT‐PCR assay detects AL121899.1 expression in multiple ESCC cell lines, using 293T cells as the control. D, qRT‐PCR assay detects AL121899.1 expression in KYSE150 and TE3 after HA‐AL12899.1 transfection. E, Transwell migration assays analyse the effects of AL121899.1 overexpression on cell migration in KYSE150 and TE3 cells. F, MTS experiments analyse the effects of AL121899.1 overexpression on cell proliferation in KYSE150 and TE3 cells. **P < .01
