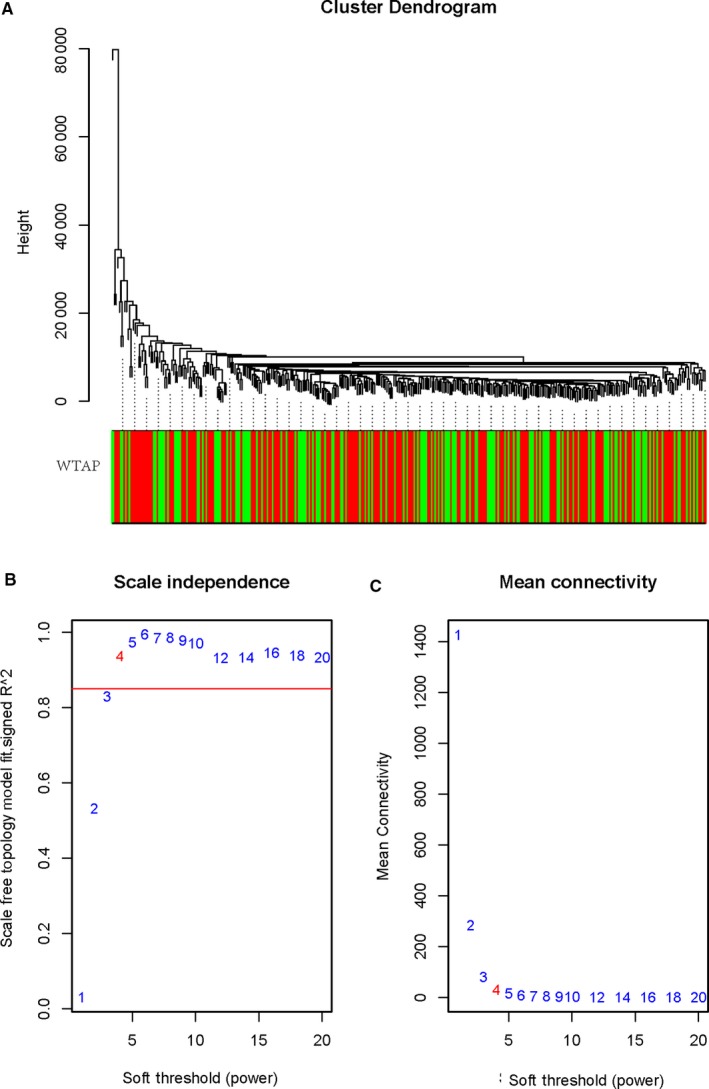
Figure 3.

Clustering of samples and determination of soft‐thresholding power. A, The clustering was based on the expression data of TCGA. The top 5000 genes with the highest sD values were used for the analysis by Wgcna. The colour intensity was proportional to expression status (WTAP low and WTAP high). B, Analysis of the scale‐free fit index for various soft‐thresholding powers (β). C, Analysis of the mean connectivity for various soft‐thresholding powers. In all, 4 was the most fit power value
