
Figure 5.
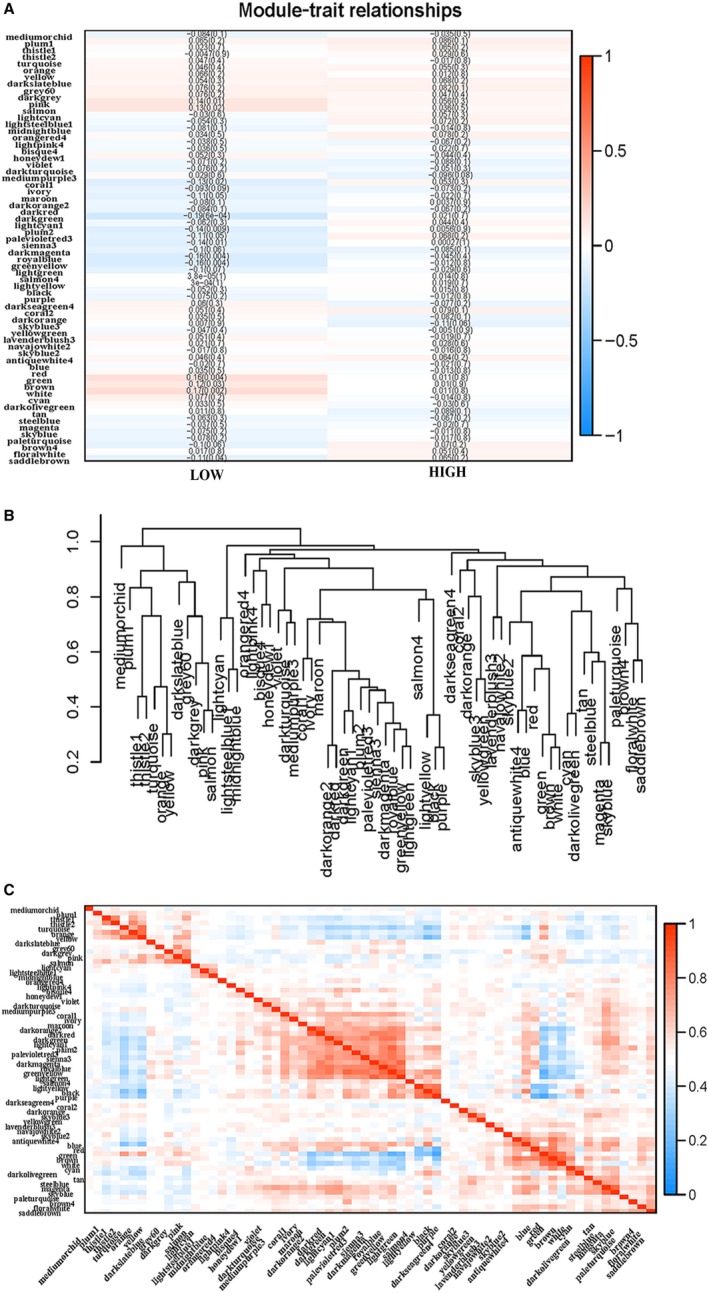
A, Heat map of the correlation between module eigengenes and the expression status of WTAP. The dark orange module was the most positively correlated with WTAP high expression, and the salmon module was the most negatively correlated with WTAP high expression. B, Hierarchical clustering of module hub genes that summarize the modules yielded in the clustering analysis. C, Heat map plot of the adjacencies in the hub gene network