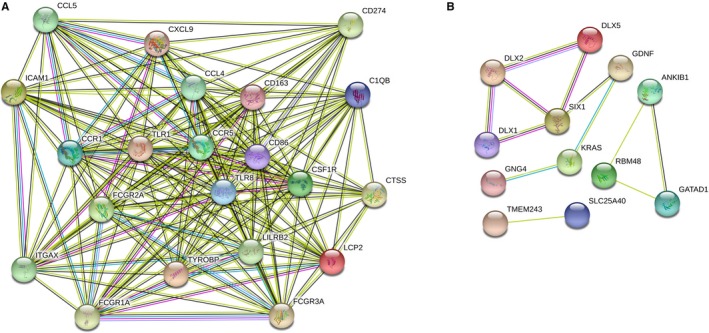
Figure 7.

A, The top hub genes in the salmon module. B, The top hub genes in the dark orange module. Edges represent protein‐protein associations. Cambridge blue: from curated databases. Violet experimentally determined. Green gene neighbourhood. Red gene fusions. Blue gene co‐occurrence. Reseda text mining. Black co‐expression. Lilac protein homology
