
Figure 10.
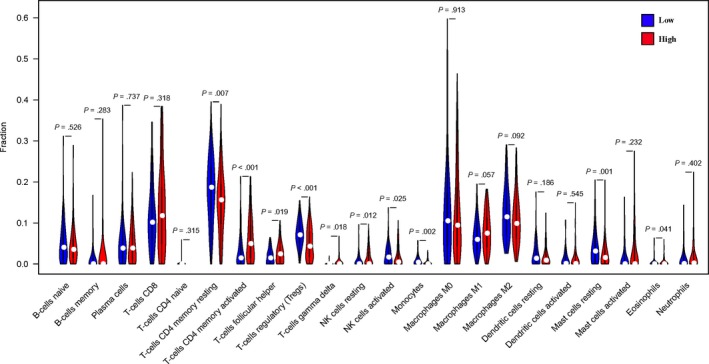
The violin map of the statistical differences between the tumour cells of different WTAP expression groups
Official websites use .gov
A
.gov website belongs to an official
government organization in the United States.
Secure .gov websites use HTTPS
A lock (
) or https:// means you've safely
connected to the .gov website. Share sensitive
information only on official, secure websites.
The violin map of the statistical differences between the tumour cells of different WTAP expression groups