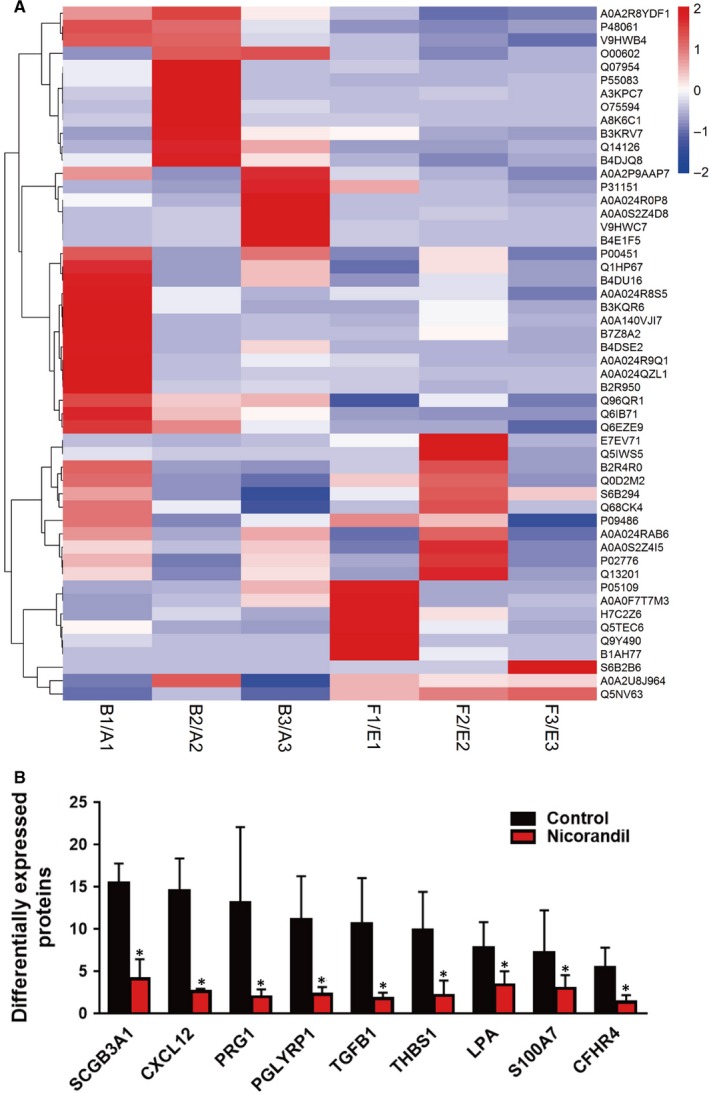
Figure 3.

Results of a cluster analysis based on samples and all significantly altered proteins. A, The colour gradient represents the expression levels of genes, as indicated on the right side. Each group was biologically repeated three times. B, Bar chart depiction of proteins that are significantly changed after PCI, and for which nicorandil treatment can partly reverse this effect
