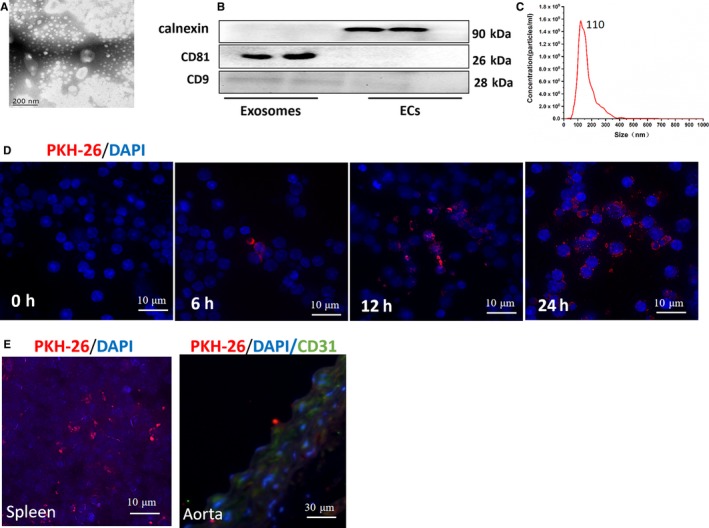
Figure 1.

Successful isolation of exosomes from ECs culture medium and the uptake assay of exosomes in vitro and vivo. A, The ultrastructure of exosomes by transmission electron microscopy. Bar: 200 nm. B, Expression of exosomes markers, CD81, CD9 and calnexin. C, The size distribution profile of exosomes by NanoSight. D, The uptake of PKH26‐labelled ECs‐derived exosomes (red) by splenic CD4+T cells in vitro. Nuclei were stained with DAPI (blue). Bar: 10 μm. E, The uptake of exosomes by spleen (Bar: 10 μm) and aorta (Bar: 30 μm) in vivo. Nuclei were stained with DAPI (blue). The aortas were stained with CD31 (green) and DAPI (blue)
