
Figure 1.
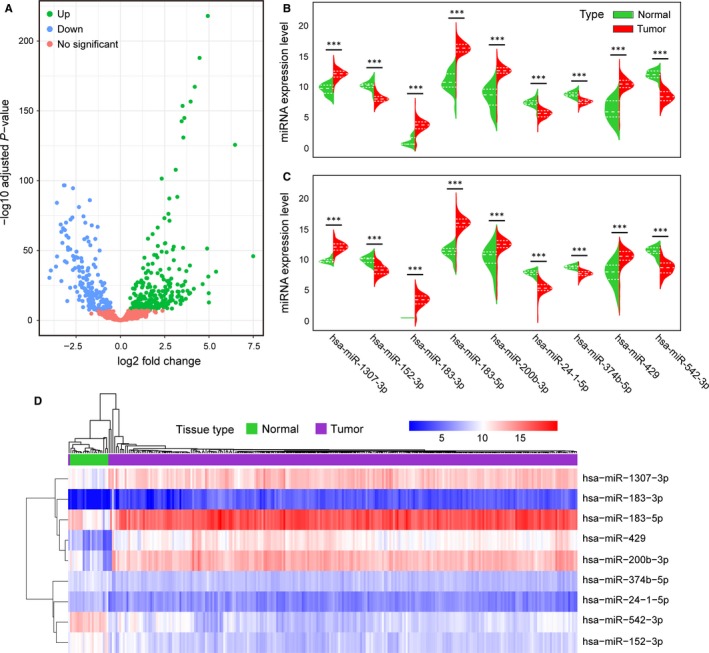
Identification of miRNA markers for diagnosis of EC. A, Differential expression analysis of miRNAs in the training cohort. B, C, The distributions of the miRNA expression data are represented by violin plots, and the dashed lines indicate the quartiles. B, The miRNA expression of nine markers in 258 tissues and 21 normal endometrium tissues in the training cohort. Adjusted P values were obtained from differential expression analysis by DESeq2. C, The miRNA expression of nine markers in 129 tissues and 11 normal endometrium tissues in the testing cohort. P values were calculated by the Mann‐Whitney U test. (*P < .05, **P < .01, ***P < .001) (D) Unsupervised hierarchical clustering and heatmap of the training cohort based on the expression profiles of the nine miRNA markers selected