
Figure 2.
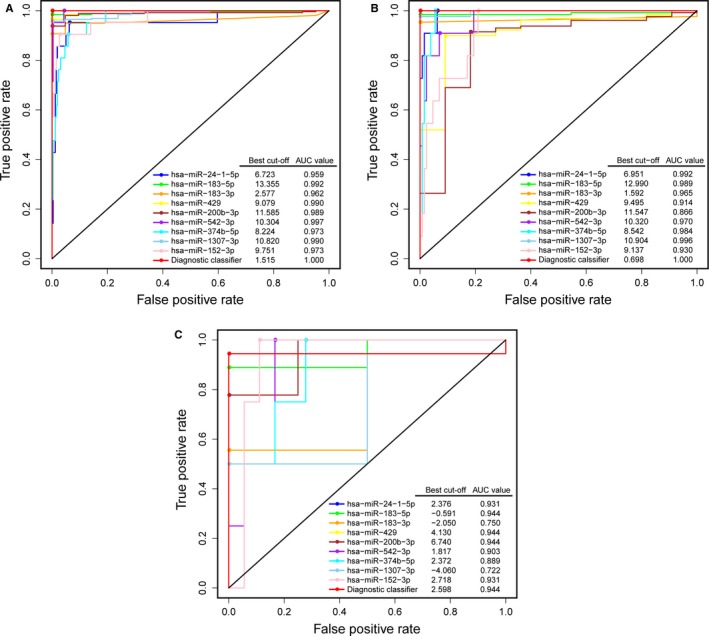
Performance of the miRNA diagnostic classifiers in tissue prediction. ROC curves of diagnostic classifiers built on each miRNA and all nine miRNA markers together in the training (A), testing (B) and GSE35794 (C) cohorts. The best cut‐off values in ROC curves were obtained to distinguish between EC and normal endometrium tissues