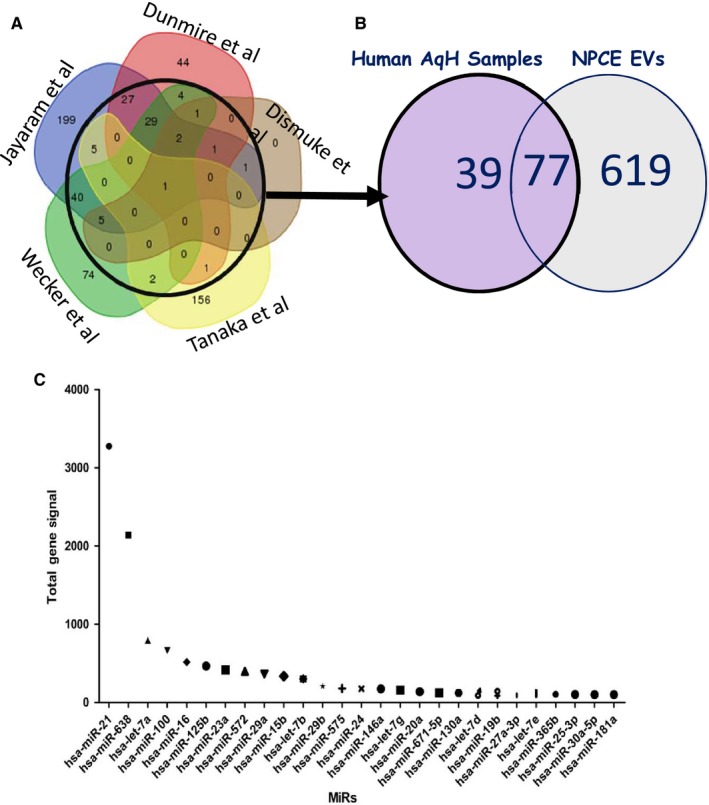
Figure 2.

A comparison of miRNAs detected in the NPCE samples to the most overlapping miRNAs families in the AH. A, The Venn diagram adapted from Hari Jayaram et al53 depicts the overlap of human AH miRNAs detected in five studies. B, Venn diagram displays the total number of miRNAs detected in the EV samples isolated from NPCE cell culture medium (n = 2) compared to the most overlapping AH miRNAs families from the published datay.53 C, Expression levels of 27 miRNAs identified in EVs derived by NPCE cell line overlapping with those observed within the AH
