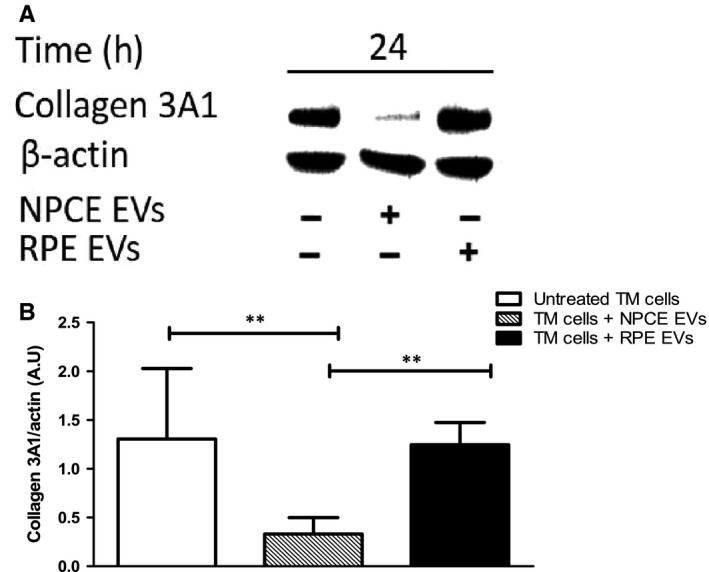
Figure 7.

Expression of type III collagen in TM cells following exposure to NPCE cell line‐derived EVs. A, Representative Western blot showing collagen 3A1 expression in TM cells exposed to NPCE or RPE EVs or untreated cells. B, Quantitative analysis of collagen levels relative to β‐actin in response to NPCE and RPE EVs. Results are representative of three independent experiments. (**P < .01 in one‐way ANOVA with post‐Tukey's test)
