
Figure 2.
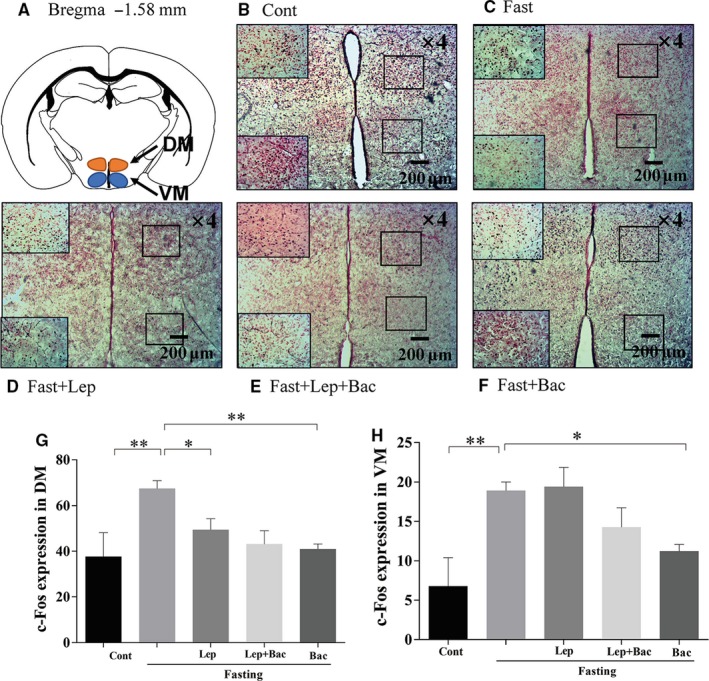
Effect of leptin or combined with baclofen on c‐Fos expression in hypothalamus. A, Schematic image of the DM and VM of hypothalamus from mouse brain stereotaxic coordinates. B‐F, Representative photomicrographs of c‐Fos expression in the DM and VM of different groups. G, H, Quantitative analysis of the c‐Fos expression in DM and VM; DM: dorsal medial nucleus of hypothalamus, VM: ventromedial nucleus of the hypothalamus; Data are represented as the mean ± SEM; (*P < .05, **P < .01. n = 2‐3 mice per group)