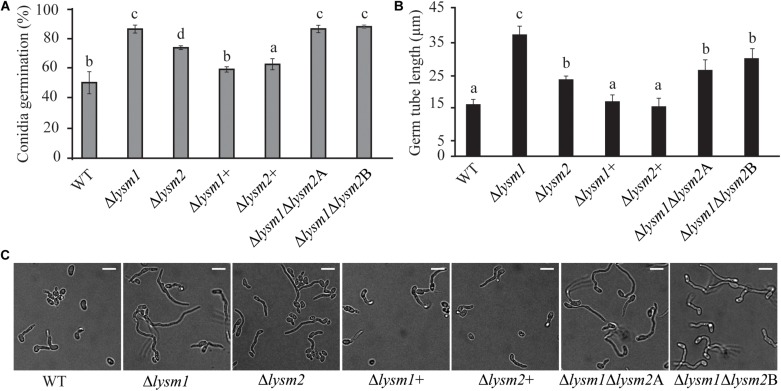
FIGURE 3.
Analysis of conidial germination and germ tube length 8 h post inoculation on half-strength PDA medium. (A,C) Frequency of germinating conidia was determined by counting the number of germinating and non-germinating conidia. (B,C) Germ tube length was measured with the ImageJ image analysis software (Schneider et al., 2012). Scale bar: 10 μm. Error bars represent standard deviation based on four biological replicates. Different letters indicate statistically significant differences (P ≤ 0.05) within the experiments based on Fisher’s exact test.

