
Figure 4.
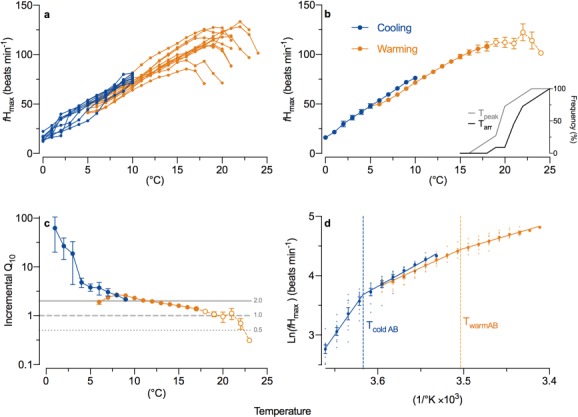
Maximum heart rate (fHmax) of anadromous Arctic char during acute warming from 5°C (orange; n = 12) and cooling from 10°C (blue; n = 8) as (a) individual and (b) average responses. The cumulative proportion of individuals that reached their temperature at peak fHmax (Tpeak) and arrhythmia (Tarr) are inset (b). The thermal sensitivity of fHmax is shown using (c) the temperature coefficient (Q10) calculated over 2°C increments, with reference lines indicating rates of change that would correspond to a doubling (2.0), plateau (1.0) or halving (0.5) of fHmax over 10°C and (d) an Arrhenius plot of fHmax showing the first Arrhenius break points during warming (TwarmAB) and cooling (TcoldAB). Averaged data (b–d) are presented ± sem and dashed connecting lines with open circles indicate temperatures where some individuals were removed from the analysis following arrhythmia.