
Figure 6.
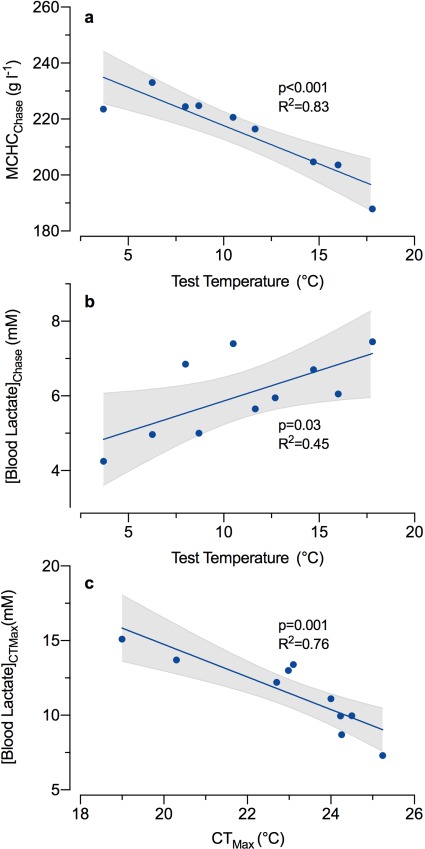
Correlations between blood properties and either the test temperature or the critical thermal maximum (CTMax). Blood was drawn immediately following the chase to exhaustion (a and b) or immediately after fish lost equilibrium at their CTMax (c). Significant relationships were identified through a pairwise Spearmen’s correlation analysis (α = 0.05; Fig. S2). Relationships for mean corpuscular haemoglobin concentration (MCHC; a) and blood lactate (b and c) are shown with their corresponding linear model (solid line) and with 95% confidence intervals (dashed line).