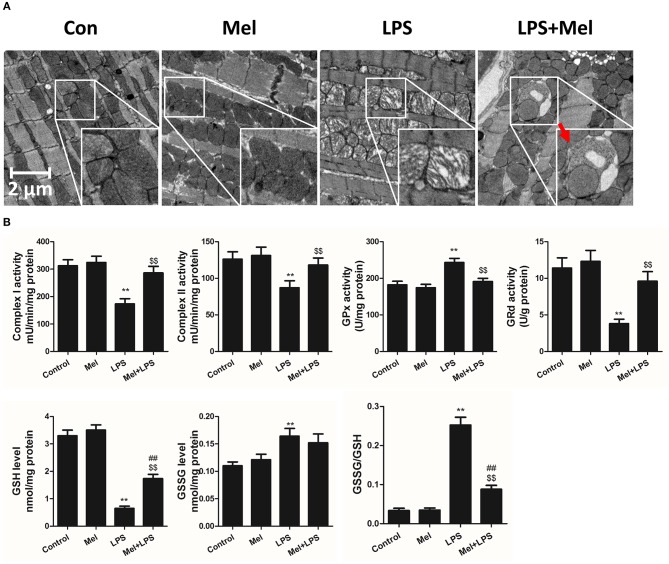
Figure 3.
Effects of melatonin administration on mitochondrial ultrastructure and function after LPS injury. (A) Representative images of mitochondrial morphology. The red arrow indicates an autophagosome. (B) Quantitative analysis of mitochondrial Complex I, Complex II, GPx, and GPd activity, and GSH, GSSG levels. n = 6 **P < 0.05 vs. the control group, ##P < 0.05 vs. the Mel group, $$P < 0.05 vs. the LPS group. Mel, melatonin.

