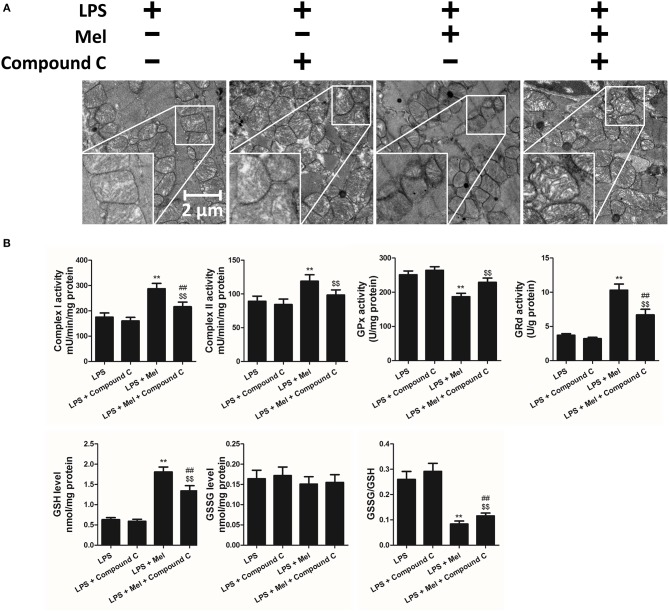
Figure 6.
Effects of Compound C treatment on mitochondrial morphology and function. (A) Representative images of mitochondrial morphology. (B) Quantitative analysis of mitochondrial Complex I, Complex II, GPx, and GPd activity, and GSH, GSSG levels. n = 6 **P < 0.05 vs. the LPS group, ##P < 0.05 vs. the LPS + melatonin group, $$P < 0.05 vs. the LPS + Compound C group. Mel, melatonin.

