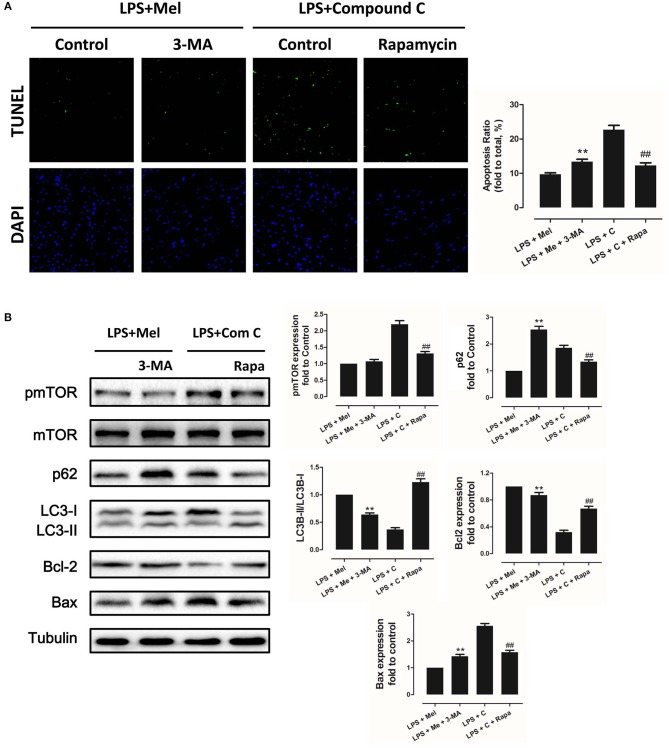
Figure 8.
Autophagy inhibition increased myocardial apoptosis, and autophagy activation decreased Compound C induced myocardial apoptosis. (A) Representative images of TUNEL staining and quantitative analysis of the apoptosis ratio. (B) Representative bands of western blot and quantitative analysis of pmTOR phosphorylation levels, p62 expression, LC3B-II/LC3B-I ratio, Bcl-2 expression and Bax expression. n = 6, **P < 0.05 vs. the LPS + melatonin group, ##P < 0.05 vs. the LPS + Compound C group. Mel, melatonin; C, Compound C; Rapa, rapamycin.

