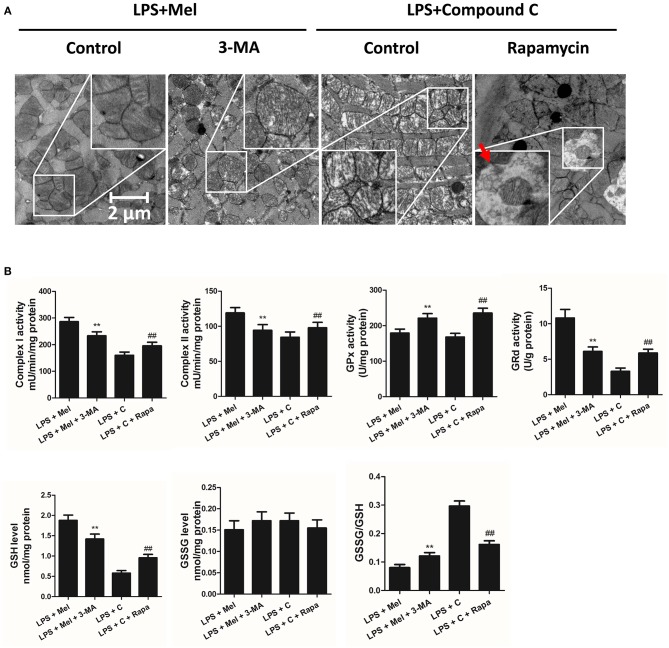
Figure 9.
Autophagy inhibition increased mitochondrial function, and autophagy activation decreased Compound C induced mitochondrial dysfunction. (A) Representative images of mitochondrial morphology. The red arrow indicates an autophagosome (B) Quantitative analysis of mitochondrial Complex I, Complex II, GPx and GPd activity, and GSH, GSSG levels. n = 6 **P < 0.05 vs. the LPS + melatonin group, ##P < 0.05 vs. the LPS + Compound C group. Mel, melatonin; C, Compound C; Rapa, rapamycin.

