FIGURE 3.
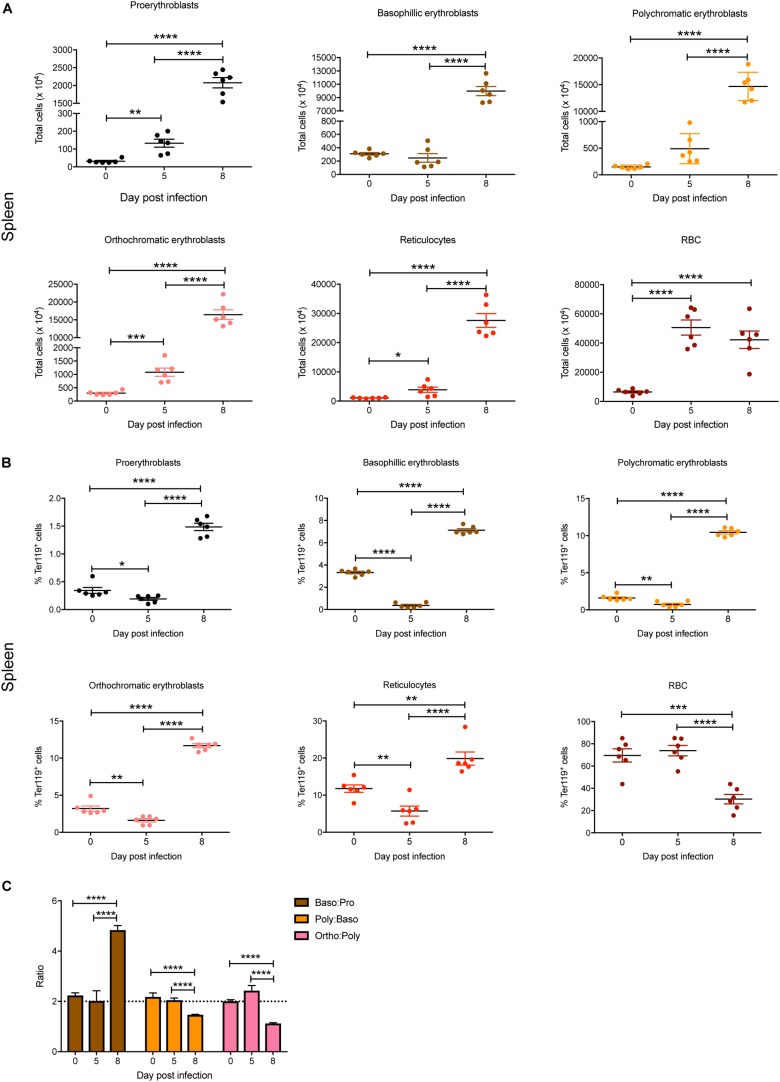
Impact of P. berghei infection on erythroblast maturation dynamics in the spleen. Analysis of the total number (A) and proportion of Ter119+ cells (B) of the indicated stages of erythrocyte maturation in the spleen during a P. berghei infection using the gating strategy outlined in Figure 1B. Plotted are the results from individual mice as well as mean ± SD (n = 6 mice). From the data in (B), the ratio of erythroblast populations was determined with mean ± SD shown (C). An unpaired t-test was used to calculate statistical significance between two groups: *p < 0.05, **p < 0.01, ***p < 0.001, ****p < 0.0001.

