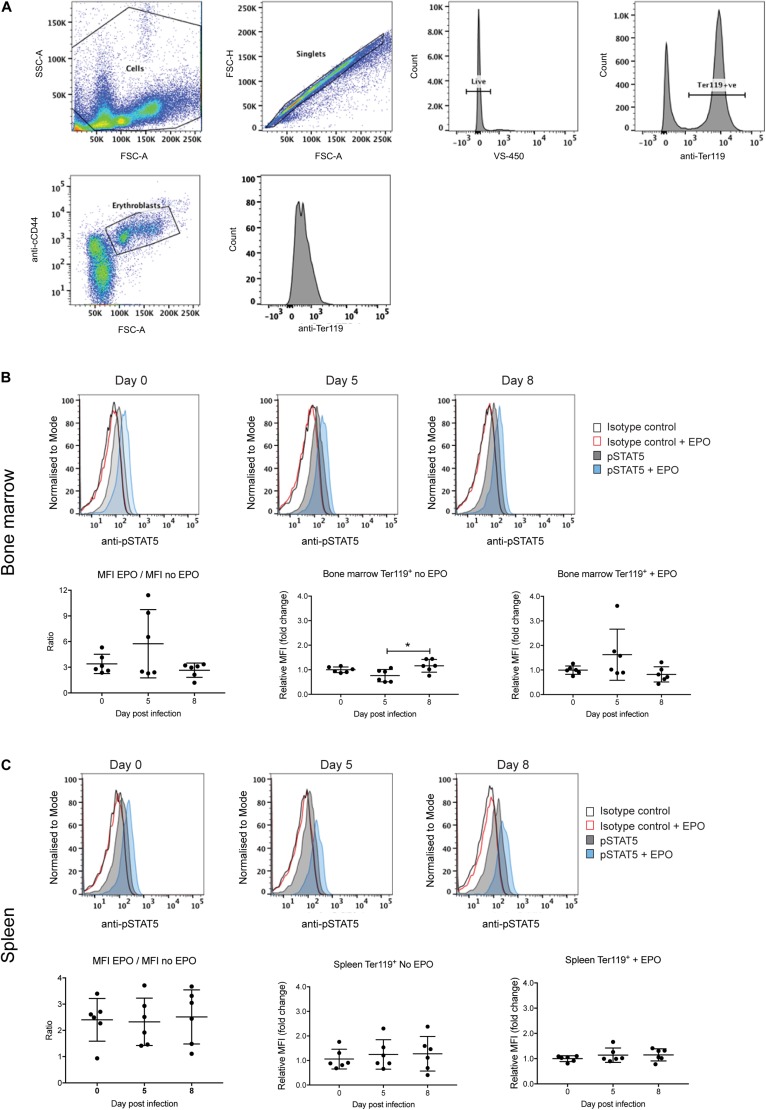
FIGURE 5.
Analysis of STAT5 activation during P. berghei infection. Gating strategy to detect pSTAT5 responses in erythroblasts (A). Fixed and permeabilized spleen cells following removal of debris (i) were stained with APC-conjugated CD44, PE-conjugated Ter119 and AF488-conjugated pSTAT5 antibodies and 7-AAD. After selection of singlets, live cells and Ter119+ cells, erythroblasts were gated based on CD44 expression and cell size and pSTAT5 staining quantified. STAT5 activation in Ter119+ erythroblasts from the bone marrow (B) and spleen (C) before and after ex vivo EPO stimulation as measured by FACS with anti-pSTAT5. Shown in the upper panels are representative medium intensity histograms of samples analyzed with anti-pSTAT5 compared to an isotype control in the presence or absence of EPO stimulation, as indicated. Data in the lower panels represents the ratio of MFI from cells stimulated with EPO to unstimulated cells as well as the fold-change ± EPO from individual mice as well as the mean ± SD (n = 6 mice). An unpaired t-test was used to calculate statistical significance between two groups. *p < 0.05.

