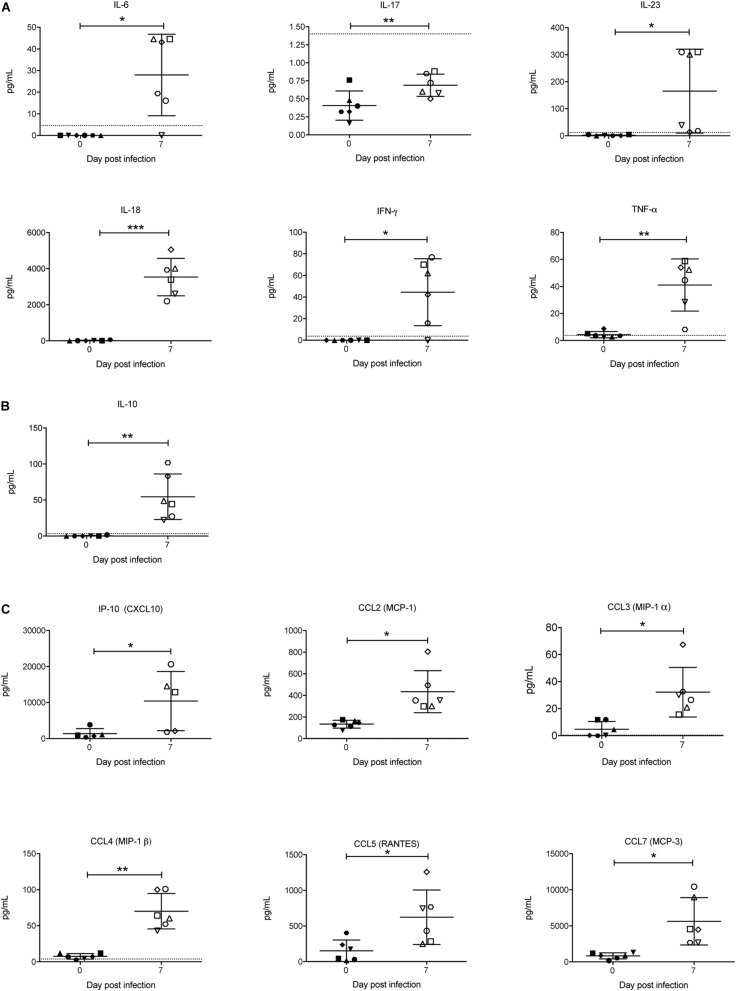
FIGURE 9.
Analysis of pro-inflammatory and anti-inflammatory cytokines and chemokines during P. berghei infection. Levels of proinflammatory cytokines (A), anti-inflammatory cytokines (B), and chemokines (C) were measured with a ProcartaPlex Mouse Cytokine and Chemokine Panel 1 kit and those that were significantly upregulated in the serum of infected mice at 7 dpi are shown. The lower limits of detection are indicated by a dotted line. Data represents results from individual mice as well as the mean ± SD (n = 6 mice). An unpaired t-test was used to calculate statistical significance: *p < 0.05, **p < 0.01, ***p < 0.001.

