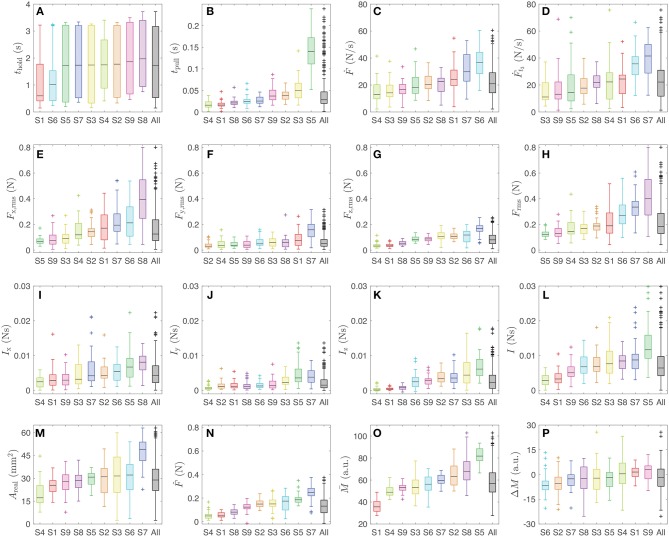
Figure 5.
Boxplots of the sixteen physical variables calculated for each participant (S1–S9), ordered by ascending median value with all subjects combined at the end. The data are color-coded by participant. In each distribution, the black line shows the median, the box shows the second and third quartiles, the whiskers show the range up to 1.5 times the interquartile range, and the + symbol indicates outliers. The plotted variables are (A) thold, (B) tpull, (C) Ḟ, (D) Ḟt3, (E) Fx,rms, (F) Fy,rms, (G) Fz,rms, (H) Frms, (I) Ix, (J) Iy, (K) Iz, (L) I, (M) Areal, (N) , (O) , and (P) ΔM.

