Figure 6.

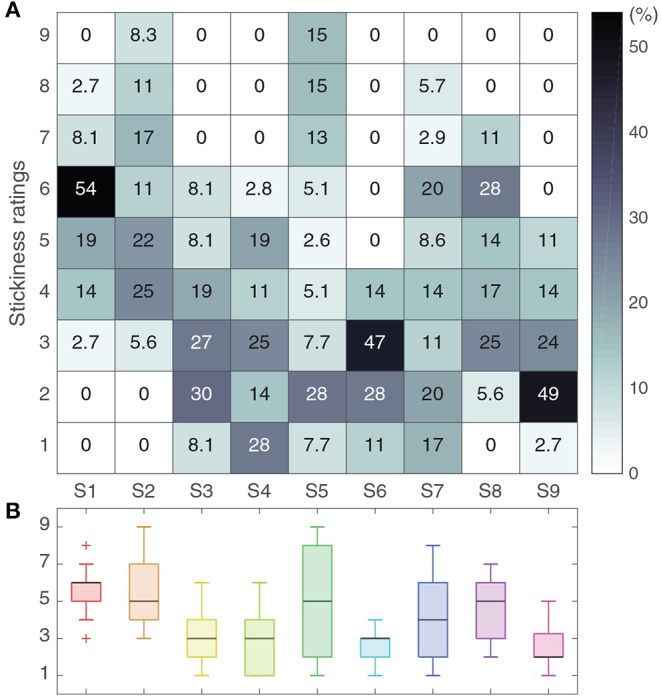
Distributions of stickiness ratings across participants. (A) The numbers in the heatmap represent the percentage of trials that received each rating. (B) The entire distribution of ratings per participant is shown as a boxplot.

Distributions of stickiness ratings across participants. (A) The numbers in the heatmap represent the percentage of trials that received each rating. (B) The entire distribution of ratings per participant is shown as a boxplot.