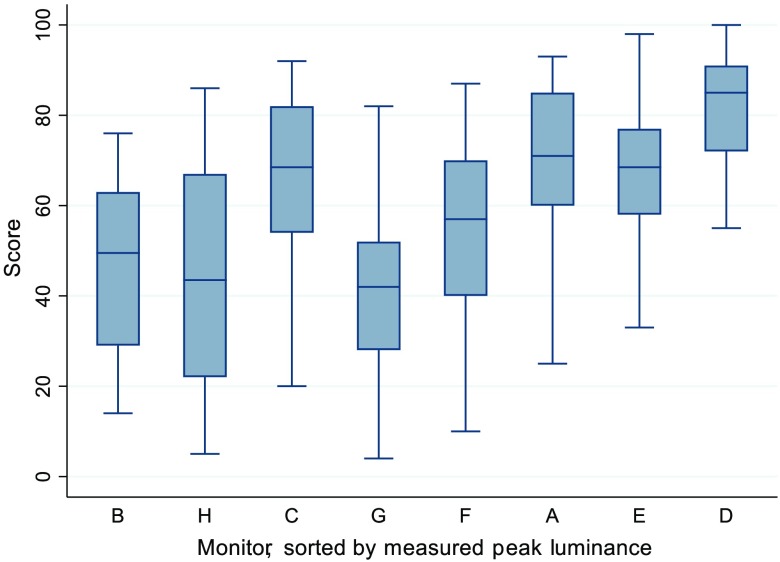
Fig. 5.
Graphical representation of the scores for each monitor, sorted by measured peak luminance, low to high, left to right. The monitor with the lowest peak luminance (monitor B) is at the far left, whereas the monitor with the highest luminance (monitor D) is on the far right. This indicates that as measured peak luminance increases, the score generally increases.

