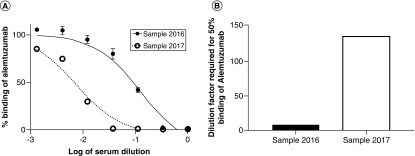
Figure 3. . The serum samples from a patient were threefold serially diluted and assayed from neat to 1/729 and the images were analyzed using the GE Developer Toolbox to quantify the number of cells with fluorescence foci and the data plotted using GraphPad Prism (A) to calculate the percentage of cells with fluorescence foci and the ID50 (B).
ID50: Dilution required for 50% inhibition.

