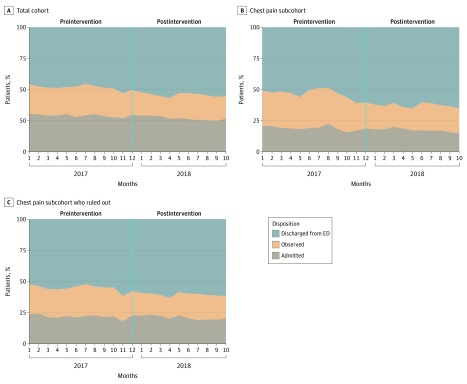
Figure 2. Proportion of Encounters Resulting in ED Discharge vs Observation and Admission.
The x-axis charts the sequence of months included in the dataset, between January 2017 and October 2018; bracketed spans mark periods before and after the intervention respectively. ED indicates emergency department.

