Figure 2.
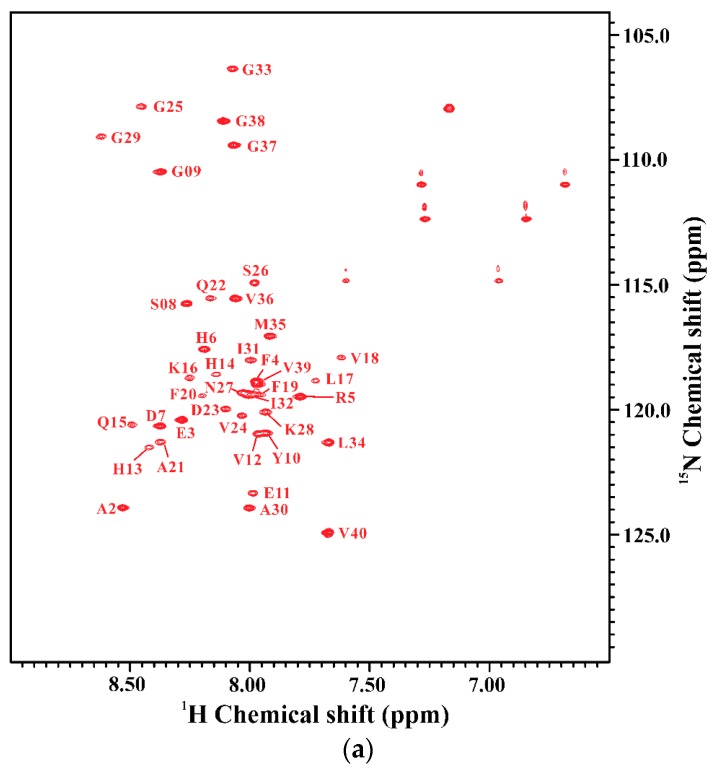
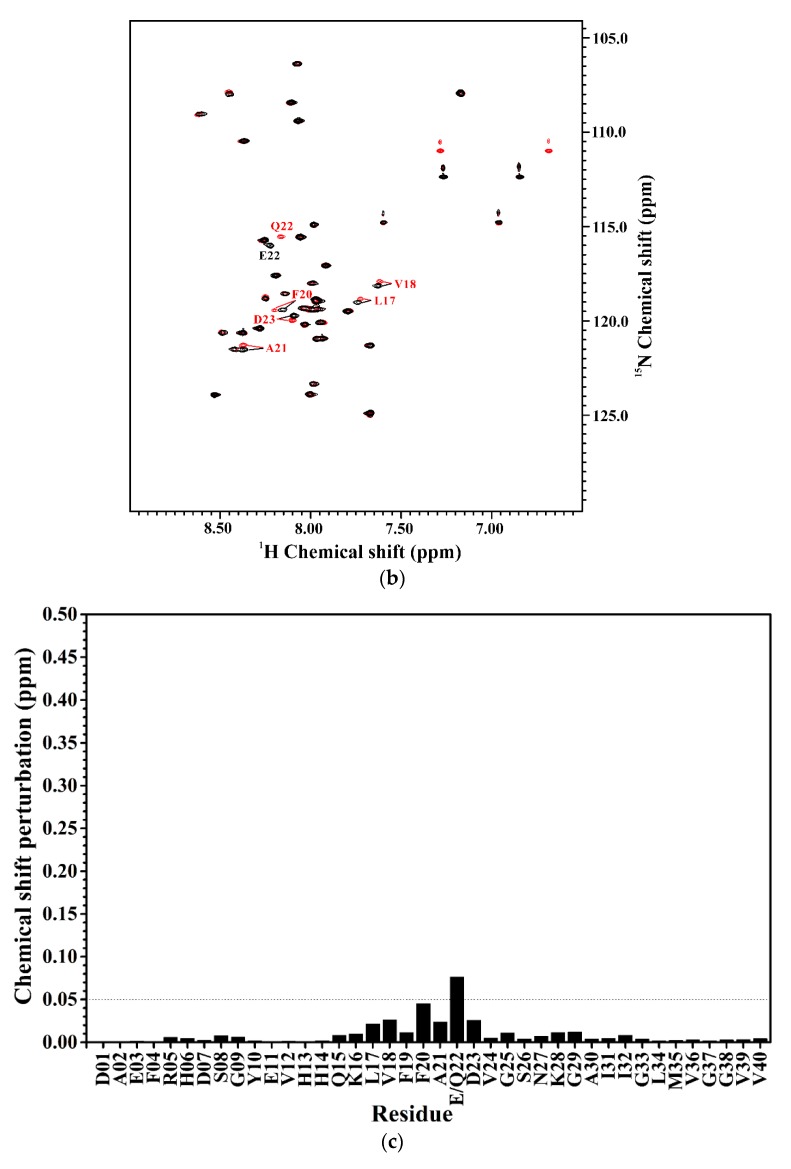
(a) Two-dimensional 1H-15N-HSQC spectrum of 15N-labeled Aβ40(E22Q) in 100 mM SDS micellar solution at 296 K; (b) Overlay of two-dimensional 1H-15N-HSQC spectra of 15N-labeled wild-type Aβ40 (black) and Aβ40(E22Q) (red) in 100 mM SDS micellar solution at 296 K. Residues which display chemical shift perturbations were labeled; (c) Chemical shift perturbation plotted as a function of residue number. Chemical shift perturbation was calculated using the equation [(HNΔppm)2 + (NΔppm/10)2]1/2, where HNΔppm and NΔppm were equal to 1HN and 15N chemical shift differences between wild-type Aβ40 and Aβ40(E22Q), respectively [31].


