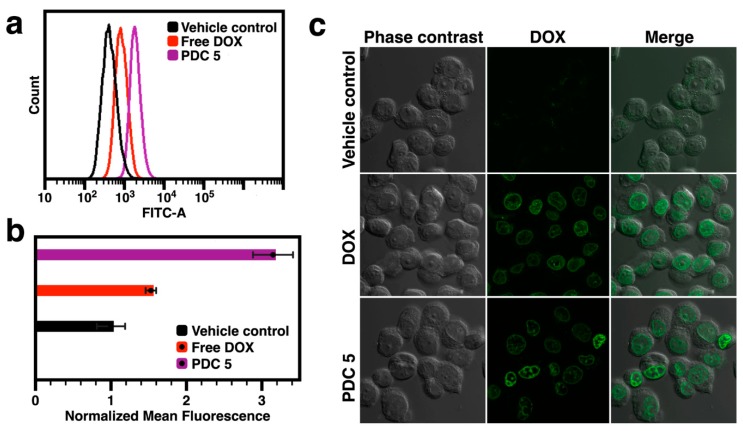
Figure 9.
(a) A typical flow cytometry data set showing cellular uptake of free DOX and PDC 5 by MCF-7 cells after 24 h incubation; (b) mean fluorescence intensity of DOX obtained from flow cytometry. For each data point, the error bar represents standard deviation resulting from three independent experiments; (c) confocal microscopy images of MCF-7 cells after 24 h incubation with DOX and PDC 5.

