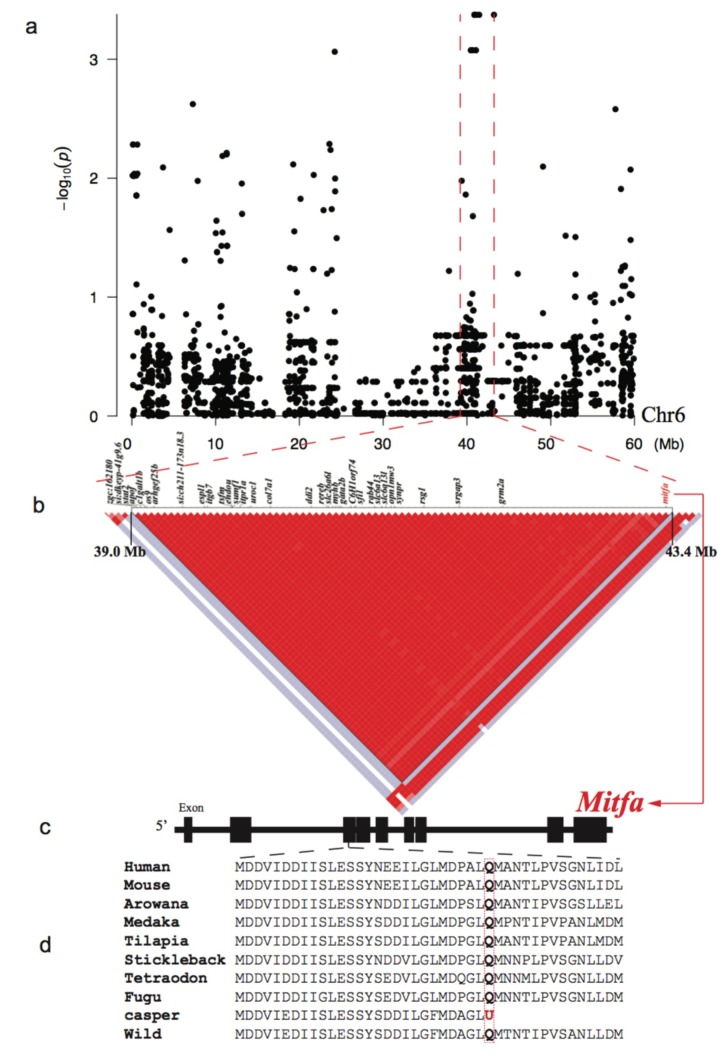
Figure 3.
Genome-wide association study (GWAS) and LD results for the melanin loss. (a) A Manhattan plot of the GWAS data. The x- and y-axes represent localization in the chr6 and p-values, respectively. The red dashed lines marked the LD block in chr6. (b) A Haplotype block with complete linkage disequilibrium (LD, r2 = 1) and its component genes within the chr6. Red and white spots indicate strong (r2 = 1) and weak (r2 = 0) LDs, respectively. (c) Detailed structure of the mitfa gene. Black boxes represent the exons. (d) A nonsense mutation (g. chr6:43360485 C>T; p. Q112U) in the mitfa of the casper strain. Note that the wt-homo and all other vertebrates have a glutamine at this site.

