Figure 1.
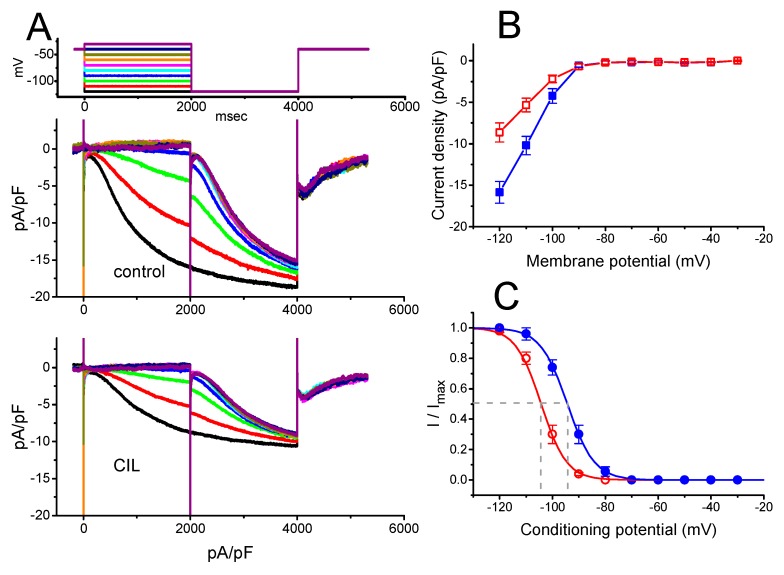
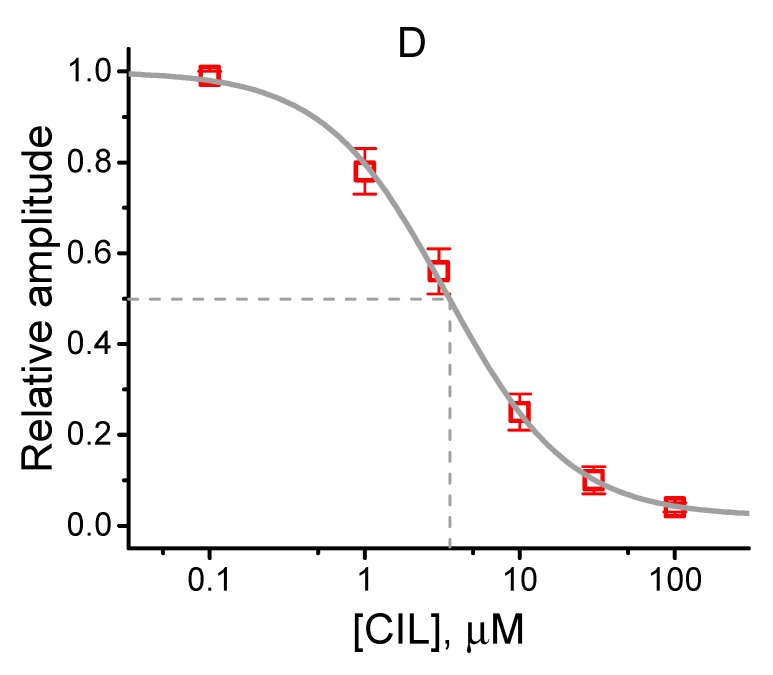
Effect of cilobradine (CIL) on hyperpolarization-activated cation current (Ih) recorded from pituitary GH3 cells. We bathed cells in Ca2+-free Tyrode’s solution containing 1 μM tetrodotoxin (TTX), and, during the recordings, we filled patch pipette by using a K+-containing solution. (A) Superimposed Ih traces obtained in control (upper) and after application of 3 μM CIL (lower). (B) Averaged current density versus voltage relationships of Ih measured in control (■) and after application of 3 μM CIL (□) (mean ± SEM; n = 8 for each data point). The current amplitude was taken at the end of the 2-s step hyperpolarization. (C) Steady-state activation curve of Ih in control (●) and after the CIL (3 μM) addition (○) (mean ± SEM; n = 8 for each data point). The vertical dashed lines are placed at the value of V1/2 for the inactivation curve. (D) Concentration-dependent inhibition of Ih produced by CIL. Each cell was maintained at −40 mV, and the current amplitude obtained during exposure to different CIL concentrations was then measured at the end of the 2-s step hyperpolarization to −120 mV. The value for IC50 (indicated in the vertical dashed line) or Hill coefficient was calculated to be 3.38 μM or 1.1, respectively. Continuous sigmoidal line in (C) or (D), on which the data points were overlaid, represents best fits to the Boltzmann (Equation (3)) or Hill equation (Equation (1)), respectively, as elaborated under Materials and Methods.


