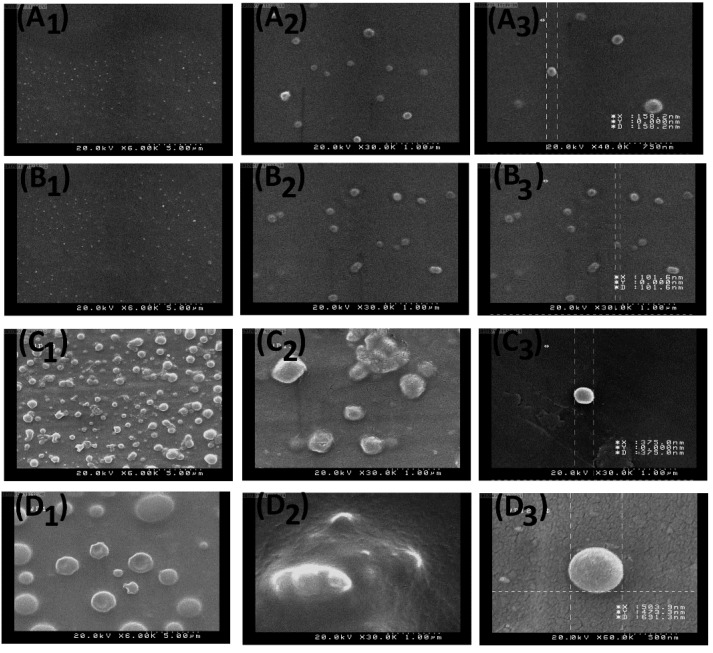
Figure 3.
FE-SEM images of the nanoparticles (NPs) with different concentration ratios: (A1) 0.1% of PLGA at 6000×, (A2) 0.1% of PLGA at 30,000×, (A3) a size representation of 0.1% of PLGA NP at 40,000×, (B1) 0.2% of PLGA at 6000×, (B2) 0.2% of PLGA at 30,000×, (B3) a size representation of 0.2% of PLGA NP at 30,000×, (C1) 0.3% of PLGA at 6000×, (C2) 0.3% of PLGA at 30,000 X, (C3) a size representation of 0.3% of PLGA NP at 30,000×, (D1) 0.5% of PLGA at 6000×, (D2) 0.5% of PLGA at 30,000× and (D3) a size representation of 0.5% of PLGA NP at 60,000×.

