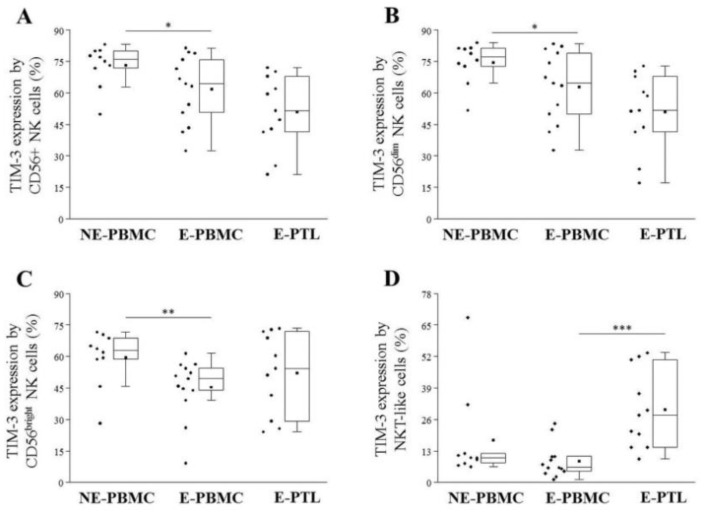
Figure 4.
Comparison of the TIM-3 receptor expression by peripheral (PBMC) and peritoneal (PTL) CD56+ NK (A), CD56dim NK (B), CD56bright (C) and NKT-like (D) cell subpopulations in non-endometriotic (NE) women and patients with endometriosis (E). The solid bars represent medians of 10, 12, and 11 determinations, the boxes show the interquartile ranges, and the whiskers show the most extreme observations. The middle square within the box shows the mean value. Statistically significant differences for p-values of *** < 0.01, ** < 0.03, and * < 0.05 are indicated.

