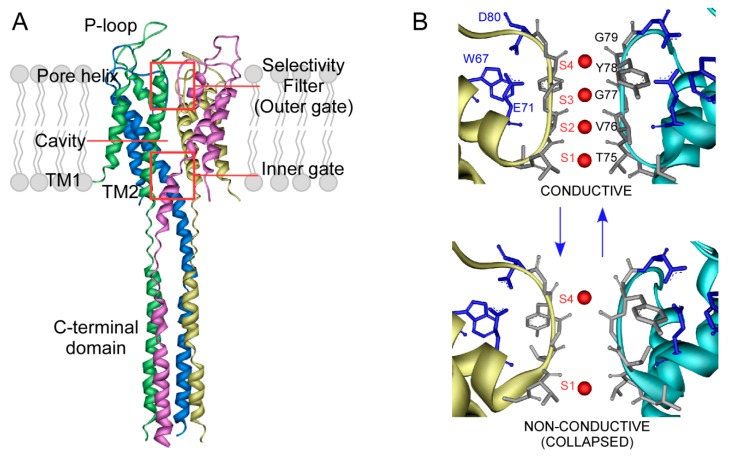
Figure 1.
Scheme of the KcsA structure. (A) Crystallographic structure of the full-length KcsA in the closed state (PDB entry: 3EFF). Main structures and domains are highlighted. (B) Zoom of the selectivity filter (SF) structure, including the signature sequence TVGYG. The inactivation triad (E71-D80-W67) location is also shown in blue sticks. The SF can adopt a non-conductive or collapsed conformation at low K+ concentration (<5 mM) (PDB entry; 1K4D). Increasing the amount of the permeant cation leads to a shift of the equilibrium to a conductive state, where all four K+ binding sites can be identified (PDB: 1K4C).

