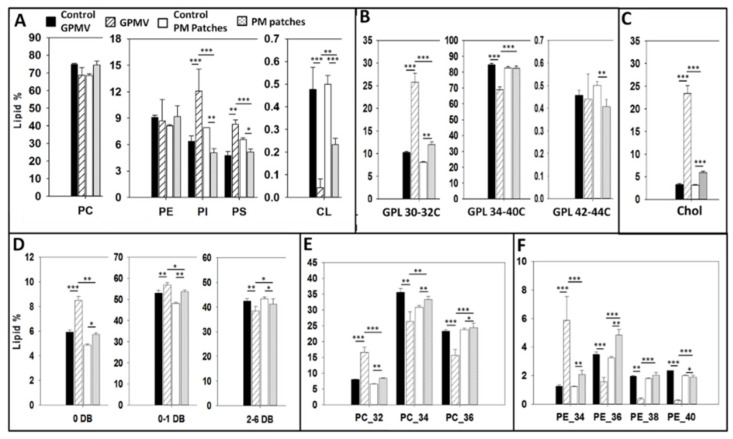
Figure 6.
Mass spectroscopy lipidomic analysis of whole cells and plasma membrane preparations. (A) Total phospholipids; (B) Short, long and very long glycerophospholipids; (C) Total cholesterol; (D) Phospholipid saturation level (DB = double bond); (E) Phosphatidylcholine distribution according to chain length; (F) Phosphatidylethanolamine distribution according to chain length. Bras: solid black, whole cells treated for GPMV preparation; striped, GPMV (blebs); empty, cells treated for PM patch preparation; dotted PM patches. Significance: (*) p < 0.0 (**); p < 0.01; (***) p < 0.001.

