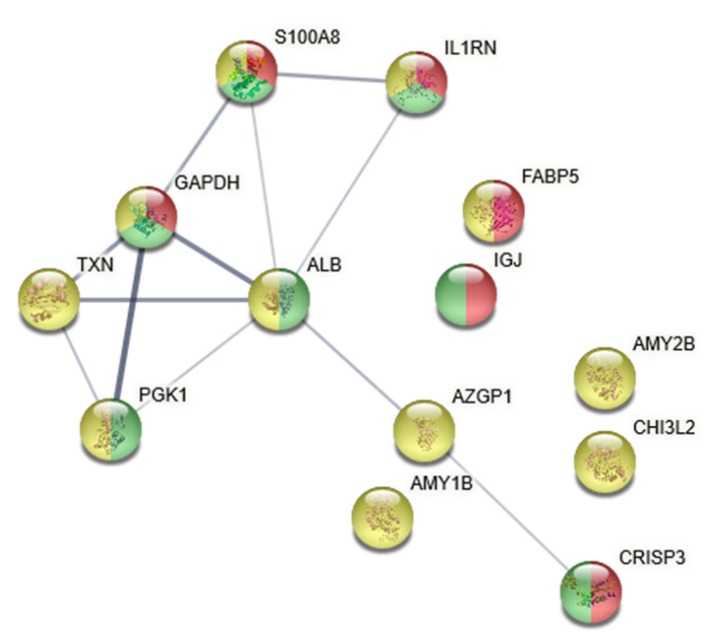
Figure 2.
Network analysis. Network analysis of important proteins for separating patients from controls using the Search Tool for Retrieval of Interacting Genes/Proteins (STRING) data analysis. The line thickness indicates the strength of data support. The majority of proteins were related to the regulation of response to metabolic processes, with a false discovery rate (FDR) of 0.03 (highlighted in yellow), to the response to stress (FDR of 0.02, highlighted in green), and to the immune response (FDR of 0.01, highlighted in red). The nodes are marked with the gene names of the proteins, and the corresponding protein names were: GAPDH = glyceraldehyde-3-phosphate; TXN = thioredoxin; PGK1 = phosphoglycerate kinase 1; ALB = serum albumin; S100A8 = protein S100-A8; IL1RN = interleukin-1 receptor antagonist protein; FABP5 = fatty acid-binding protein; IGJ = immunoglobulin J chain; AXGP1 = zinc-alpha-2-glycoprotein; AMY1B = amylase, alpha 1B; AMY2B = amylase, alpha 2B; CHI3L2 = chitinase-3-like protein 2; CRISP3 = cysteine-rich secretory protein family.

