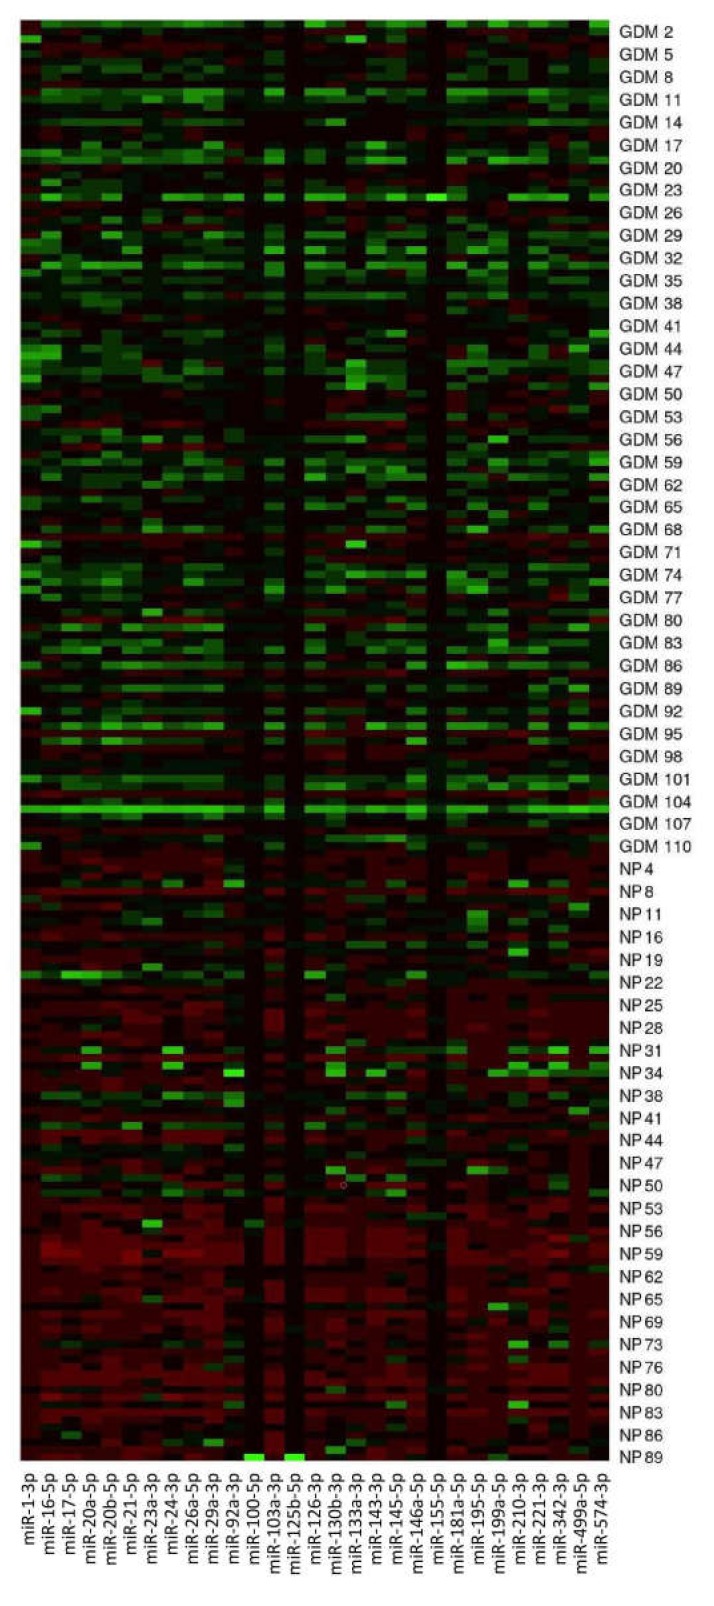
Figure 1.
Postpartal microRNA expression profile in mothers with a history of GDM pregnancies. MicroRNA gene expression data (2−ΔΔCt) are visualized using the heat map. In this setting, each row represents a sample (GDM1–GDM111, NP1–NP89) and each column represents a microRNA gene. The color and intensity of the boxes are used to represent changes of gene expression (2−ΔΔCt). Green color indicates upregulation, and red color indicates downregulation. NP, normal pregnancies.

