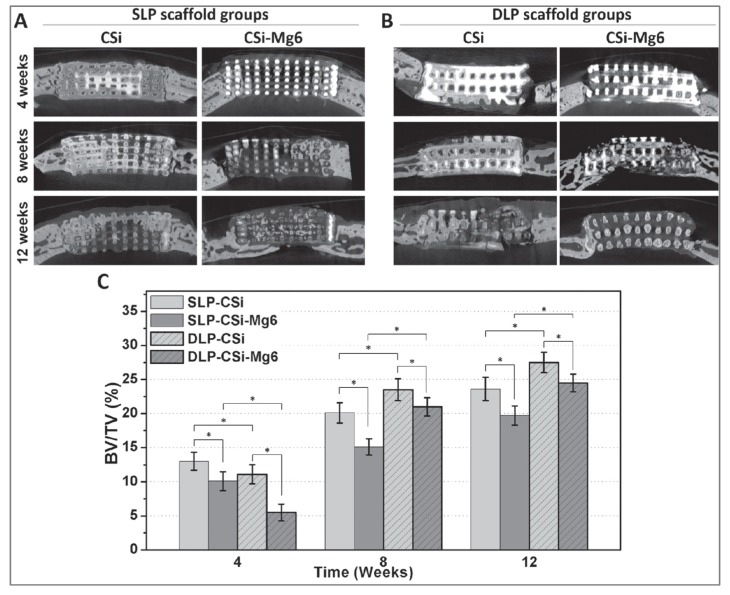
Figure 2.
Osteogenesis of the ceramic scaffolds in vivo. (A) The cross-sectional images of implanted ceramic scaffolds of CaSi and CaSi–Mg6 with single layer pore morphology by microCT scanning after 4, 8, and 12 weeks, respectively. (B) The cross-sectional images of implanted ceramic scaffolds of CaSi and CaSi–Mg6 with double layer pore morphology by microCT scanning after 4, 8, and 12 weeks, respectively. (C) Morphometric analysis of the volume of the newly formed bone (BV/TV) in the skull defect area at 4, 8, and 12 weeks with single layer pore morphology and double layer pore morphology, respectively. (*p < 0.05) [116].

