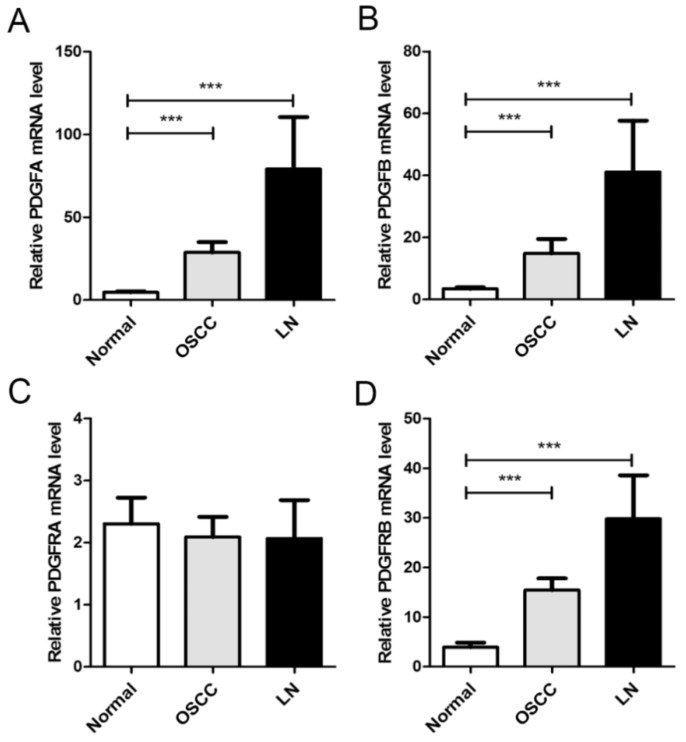
Figure 1.
mRNA expression profiles of matched non-cancerous oral mucosa, cancer, and lymph node metastatic tissues. Histograms showing the mRNA levels of PDGFA (A), PDGFB (B), PDGFRA (C), and PDGFRB (D) in matched non-cancerous oral mucosa, cancer, and lymph node metastatic tissues. The relative mRNA expression levels were calculated using the 2−ΔΔCt method. ***, p < 0.001

