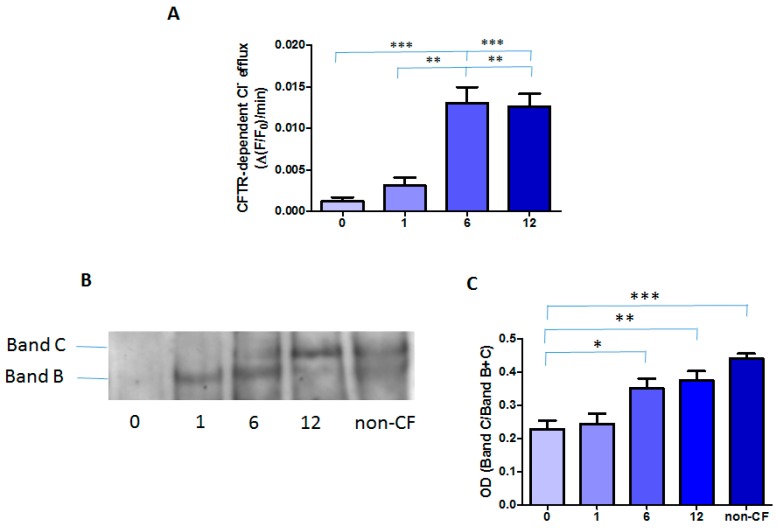
Figure 3.
CFTR activity and protein in MNCs: (A) cumulative data of CFTR activity obtained from 14 patients; (B) a representative Western blot of CFTR protein; and (C) densitometric analysis of Western blots represented as the OD ratio of Band C over Bands B and C in three CF subjects and in a pool derived from five non-CF subjects. Data are shown as mean ± SEM. * p < 0.05, ** p < 0.01, *** p < 0.001.

