. 2020 Mar 25;13(7):1498. doi: 10.3390/ma13071498

Table 5.

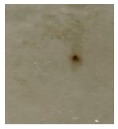
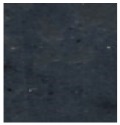
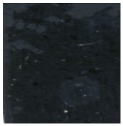
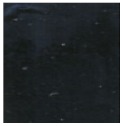
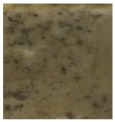
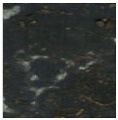
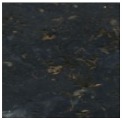
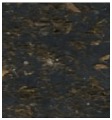
Topography photos of surface changes of SBR composites before and after biodegradation tests.

Composite Symbol SBR SBR5 SBR10 SBR20 SBR30
BEFORE BIODEGRADATION graphic file with name materials-13-01498-i001.jpg graphic file with name materials-13-01498-i002.jpg graphic file with name materials-13-01498-i003.jpg graphic file with name materials-13-01498-i004.jpg graphic file with name materials-13-01498-i005.jpg
dL × ab 3.84 0.99 0.20 0.26 0.46
AFTER BIODEGRADATION graphic file with name materials-13-01498-i006.jpg graphic file with name materials-13-01498-i007.jpg graphic file with name materials-13-01498-i008.jpg graphic file with name materials-13-01498-i009.jpg graphic file with name materials-13-01498-i010.jpg
dL × ab 7.35 2.63 1.34 4.52 3.18