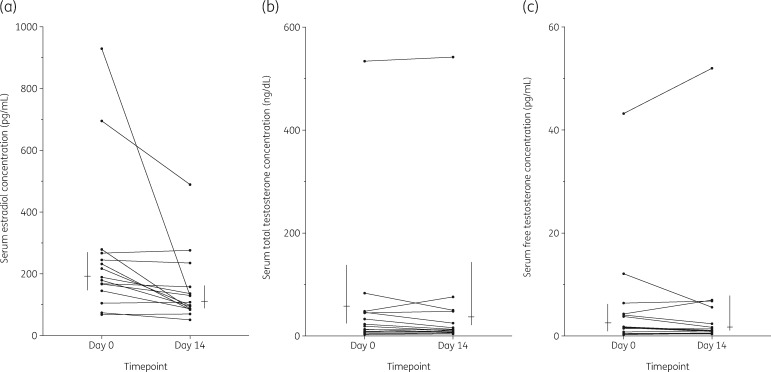
Figure 2.
(a) Participant serum estradiol concentration before (day 0) and during steady-state tenofovir/emtricitabine 300/200 mg (day 14), n = 15. Wilcoxon signed-rank paired comparison: P < 0.001. Vertical lines represent median (IQR) concentrations on day 0 and day 14. (b) Participant serum total testosterone concentration before (day 0) and during steady-state tenofovir and emtricitabine concentrations on day 14 post administration of tenofovir disoproxil fumarate/emtricitabine (300/200 mg), n = 15. Wilcoxon signed-rank paired comparison: P = 0.38. Vertical lines represent median (IQR) concentrations on day 0 and day 14. (c) Serum free testosterone concentration on day 0 and day 14; Wilcoxon signed-rank paired comparison: P = 0.68. Vertical lines represent median (IQR) concentrations on day 0 and day 14.

