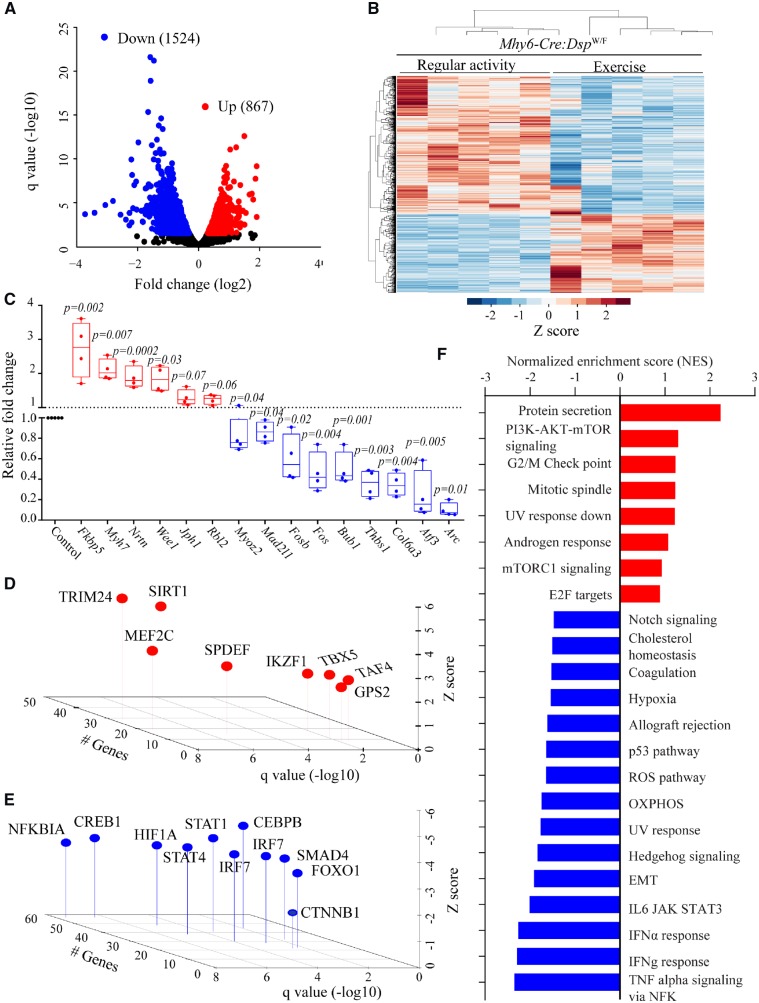
Figure 2.
Effects of treadmill exercise on cardiac myocyte transcriptome. (A) Volcano plot showing down-regulated and up-regulated genes in cardiac myocytes isolated from the hearts of Myh6-Cre:DspW/F mice in the treadmill exercise group as opposed to the regular activity group (N = 5 per group). (B) Heat map of DEGs between indicated groups showing clustering based on the genotypes. (C) Quantitative PCR data for top dysregulated genes in isolated cardiac myocytes from Myh6-Cre:DspW/F in the regular activity group (N = 5) and Myh6-Cre:DspW/F in the treadmill exercise group (N = 4). (D and E) TFs predicted to be activated (D) and suppressed (E) based on DEGs with a q < 0.05 in Myh6-Cre:DspW/F myocytes in the treadmill exercise group as compared to the regular activity group. The X-axis represents −log10 of q value, the Y-axis represents Z score, and the Z-axis represents number of genes predicted to be targets of each TF. (F) Dysregulated biological pathways corresponding to DEGs with q < 0.05. Pathways with q < 0.05 and normalized enrichment score, in the X-axis, are shown. P-values were calculated by t-test for normally distributed data and Mann–Whitney test for those departing from normality.

