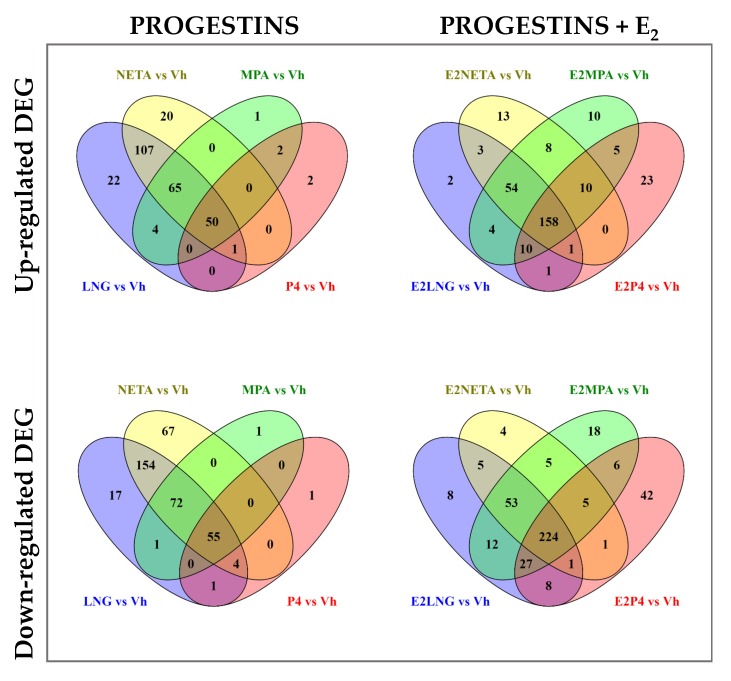
Figure 2.
Venn diagram of differentially expressed genes among the four progestins alone or in combination with E2. Upper panel shows Venn diagrams of up-regulated DEG for each progestin versus Vehicle alone (left panel), or in combination with E2 (right panel). Lower panel shows Venn diagrams of down-regulated genes for each progestin versus vehicle alone (left panel), or in combination with E2 (right panel). Fold change (FC) ≥ 1.5 and Benjamini-Hochberg adjusted p < 0.05.

