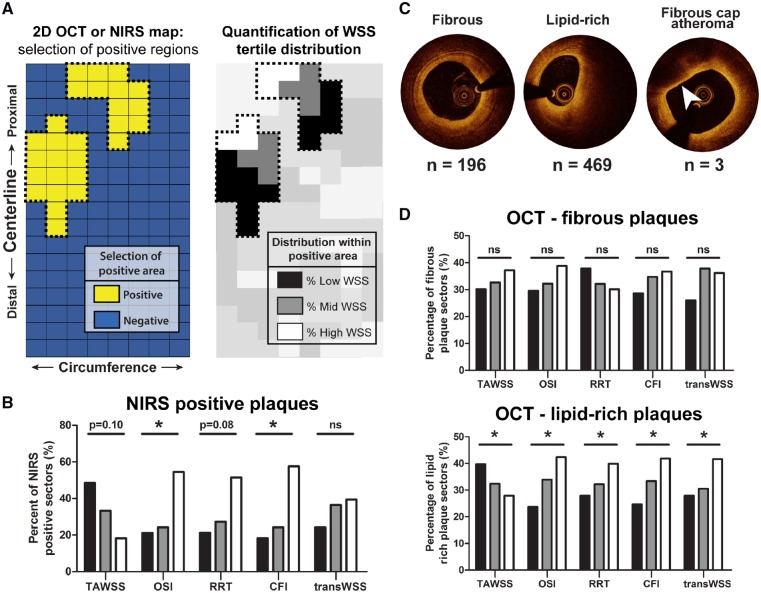
Figure 3.
Association between T1 WSS levels and final plaque composition detected by OCT and NIRS in advanced-diseased (AD) pigs at Tlast. (A) OCT and NIRS analysis method on an imaginary two-dimensional map: all NIRS or OCT positive 3 mm/45° sectors were selected. Within these positive regions, the percentage of positive sectors that was preceded by one of the WSS tertiles was quantified. (B) The percentage of NIRS-positive sectors (n = 33) that was preceded by low (black bars), mid (grey bars), or high (white bars) levels of the respective T1 WSS tertiles (TAWSS, OSI, RRT, CFI, and transWSS). *P < 0.05 for the overall relations (statistics: χ2 test). (C) Example images of fibrous, lipid-rich, and fibrous cap atheroma (arrowhead) plaques on OCT. n, number of sectors of ADs presenting with each respective plaque classification at Tlast. (D) The percentage of sectors presenting with fibrous or lipid-rich plaque that was preceded by low (black bars), mid (grey bars), or high (white bars) levels of the respective WSS metrics. Fibrous plaques displayed no significant relation (P = ns). *P < 0.05 for the overall relations (statistics: χ2 test).

