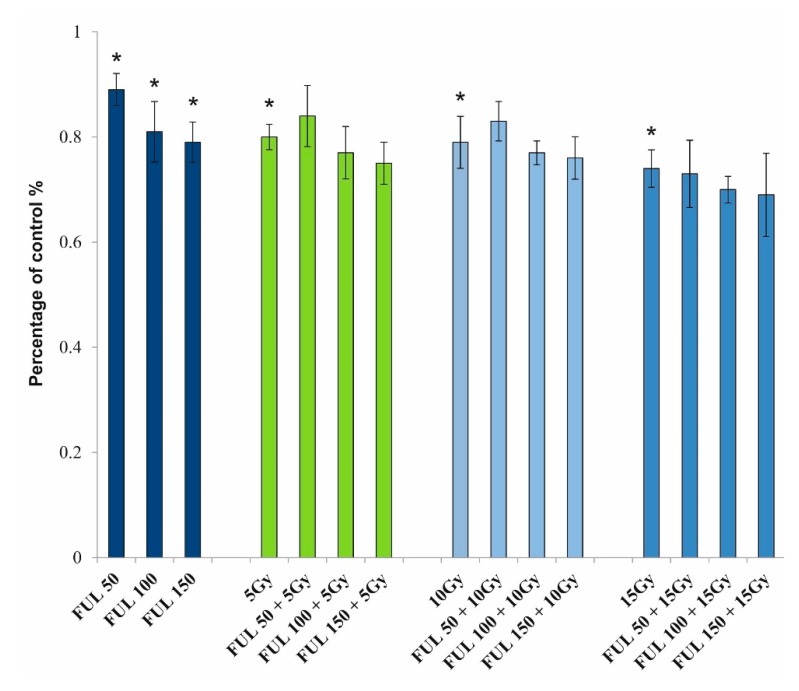
Figure 10.
Mitochondrial membrane potential of PBMCs. PBMCs were incubated with fullerenol C60(OH)36 (50, 100, and 150 mg/L) for 24 h (37 °C, 5% CO2 atmosphere, 100% relative humidity) and irradiated with the doses of 5, 10, and 15 Gy. The presented values are the fraction of untreated cells (control) for which the value was set at 1.0. Bars represent mean values with standard deviations. Asterisks are used to mark values that are statistically different in comparison with control values (* p < 0.05). All experiments were repeated 4 times.

