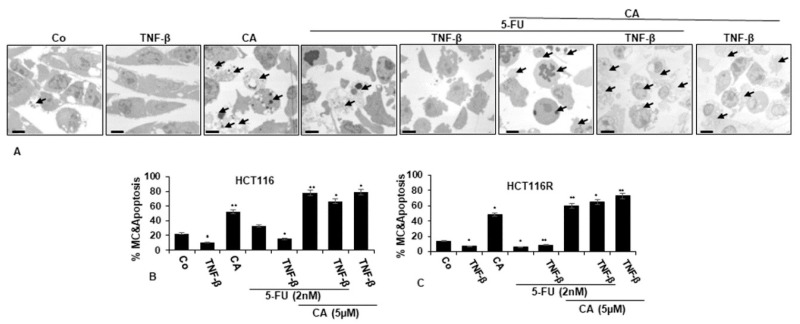
Figure 3.
Transmission electron microscopic demonstration of cell viability and apoptosis of CRC cells after treatment with Calebin A and/or 5-FU in TNF-β-promoted inflammatory tumor environment. Serum-starved HCT116 (A,B) and HCT116R (C) in monolayer cultures were treated as described in the Materials and Methods section for 72 h, and ultrastructural investigations performed to investigate cell survival and apoptosis (black arrows). The number of apoptotic cells (B,C) was quantified by counting 800–1000 cells from 30 microscopic fields from at least three independent experiments. p < 0.05 (*) and p < 0.01 (**) were regarded as statistically significant values compared to control cultures. A: Magnification: ×5000, scale bar = 1 μM. MC: mitochondrial changes.

